The Bitcoin Bottom and Bull Case
First of all, this is not financial or investment advice. It is an opinion piece looking at the bullish side of the argument for Bitcoin. Do your own research and speak to your independent financial advisor before making any financial decisions.
If we were to only look at one chart then the Bitcoin bull market comparison is it. So everyone is on the same page, the bank of Bitcoin has no members, no buildings and no bankers manipulating rates trying to balance inflation with full employment. It runs on code; it always has and it always will. It makes the Bitcoin Miners (computers) complete a puzzle and the first one to do so is rewarded with new Bitcoin. This happens roughly every 10 minutes, before being repeated. The amount of Bitcoin the miners get is the emission (inflation) and it too is governed by code. The emission of new Bitcoin is halved every 4 years, and the inventive bunch that Bitcoiners are named this a ‘halving’.
Tl;dr every 4 years, the supply of new Bitcoin is halved.
Now for the economics lesson that everyone knows. Price is a function of supply and demand.
This is why we see a rally in price in the period after each halving (the left of the chart).
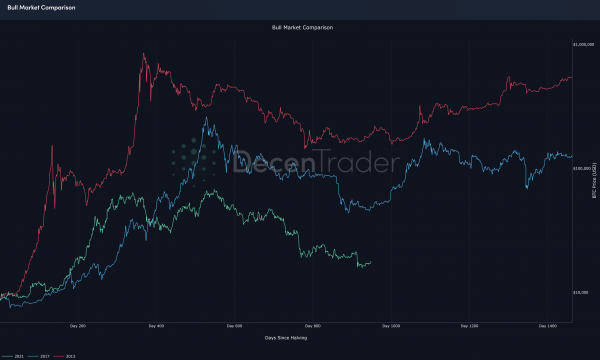
Lets compare market cycles. In our current cycle (the mint green line), we have been experiencing a prolonged downtrend and are in the period in past cycles where a cycle bottom has formed. Note that even after the prolonged drawdown (typically around 85% from the highs), each cycle’s lows are still considerably higher than at the halving. Further, each cycle follows directly on from the previous, blue (2017) starts at the end of the red (2013) cycle, mint green (2021) starts at the end of blue. For those that remember those periods in the markets (hi and well done for staying strong), you’ll remember the “Bitcoin is dead” stories and the despair in the market. If you want a handy tool for tracking each time the media has declared Bitcoin dead, use Bitcoin Obituaries. However, around the 1000 day mark (day 1002 in 2013, 998 in 2017) Bitcoin rallied out of its cycle lows, providing a four-five fold return in a matter of months. For reference we are currently on day 948.
So we have covered the supply side. Let’s quickly cover the demand side.
Since the last cycle we’ve had:
- 2 countries adopt Bitcoin as legal tender (El Salvador and Central African Republic)
- Multiple billion dollar companies add it to their balance sheets (Tesla, Microstrategy, SpaceX)
- Fidelity ($4.5 trillion AUM) offer Bitcoin trading to its 40 million clients
- The world’s largest financial firm, BlackRock ($10 trillion AUM) roll out crypto trading services to institutional clients
- UK’s Prime Minister Rishi Sunak trying to make the UK a “crypto hub”, finalizing British regulation
- EU Markets in Crypto Assets regulation, allowing clarity for European financial institutions
- Goldman Sachs ($2.5 trillion AUM) looking to buy up crypto companies
Moreover, the bottom five points have all happened since November this year! What do they know that you don’t?
Further, we have other key metrics at or near all-time highs! The number of Bitcoin ATMs worldwide, the number of wallets holding at least 1 Bitcoin and the computational power of the network are just some of the hallmarks of continued faith and adoption of the Bank of Bitcoin.
The new supply side of the equation is set in code. There is a strong argument for new demand, through continued adoption. However, this does not mean price will instantly reflect this, markets are not truly rational or efficient. And in price is where we will find most people’s argument against Bitcoin. Currently, it is down 75% since the highs of last year. However, price is reactive to supply and demand – not the other way around.
For comparison here are the current drawdowns of several large companies:
Facebook -69%
Snapchat -88%
Netflix -54%
Amazon -51%
Tesla -61%
Are all these companies dead as well? Or are we missing something? All of these assets peaked around a similar time last year and they all measured in US Dollars. What has happened since November 2021 is that the US Central Bank (the Federal Reserve) has raised interest rates. They were at 0.1% and are now sitting at 4% (likely at 4.5% once this goes live). This is not an increase of 3.9%, but one of 4000%. If you were to borrow $1000 it used to cost $1 and now it costs $40. Borrowing money has gotten 40x more expensive. So, if Dollars have gotten more expensive, that makes everything it measures look cheaper.
Let’s look at some Bitcoin native valuations for showing if it is under or overvalued by traditional metrics.
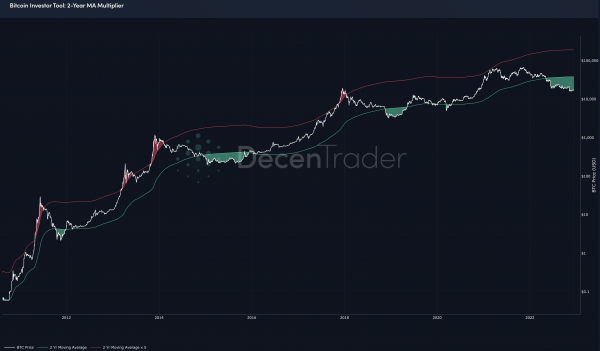
As Bitcoin moves in 4 year cycles, taking the 2 year moving average has historically found points where Bitcoin has been over (red) or under (green) valued. Currently, we are deep in green territory which has been the area of a market bottom and thus amongst the best value opportunities of the cycle.
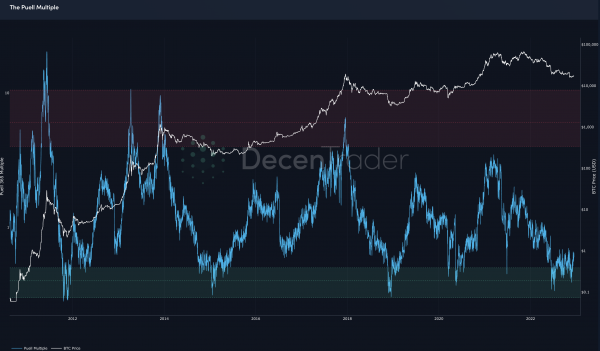
The Puell Multiple is a metric for valuing Bitcoin based on the supply side of the equation. It calculates the daily issuance of new Bitcoins (in USD) and divides it by the 365 day average of daily issuance. This effectively shows when miners might be selling their Bitcoin to cover costs – something that has coincided with market lows. We have spent a couple months in the green band, again highlighting an opportunity.
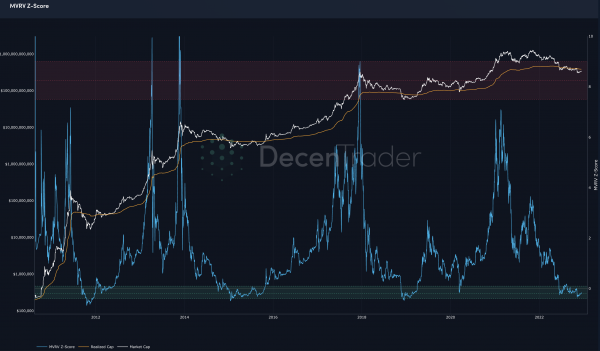
The MVRV-Z Score identifies periods when Bitcoin is extremely over or undervalued relative to its ‘fair value’. It does this by dividing the market value by the realized value (the price people actually paid for the coins). Again, this is in the green band flashing an undervalued signal.
So, we have confluence amongst all these metrics. Now let’s go back to the Dollar question. What if the Dollar remains strong forever? This is a relative question as in its history, it is down over 99%. But maybe the Federal Reserve keeps raising rates. What will happen in this scenario is the US Government will default on the massive pile of debt it has to pay interest on. The US defaulting would collapse the country as it cannot pay for anything, and the rest of the world would have no faith in the Dollar being redeemable for anything.
Maybe the Federal Reserve maintains its delicate balancing act of raising and lowering rates. In this scenario, the Dollar becomes cheaper as rates are lowered. There are no other scenarios and both result in a cheaper Dollar. The markets are already starting to price this in, and we have seen the Dollar start losing strength when compared to a basket of other currencies.
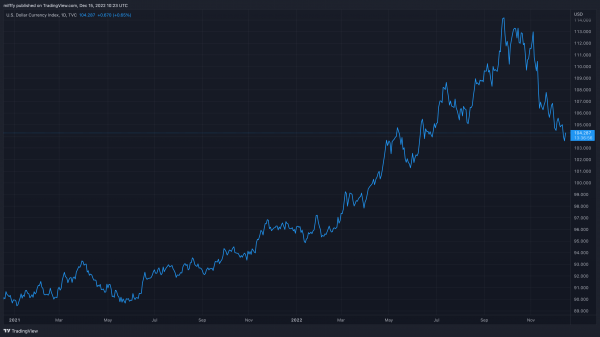
The Dollar Index, down nearly 9% since the highs of this year
In-fact, we are already seeing the implementation by business, protocols and projects to try to replace the US Dollar with Bitcoin. You can borrow and lend against it, purchase houses and mortgages with Bitcoin and pay anyone on earth instantly. Many of these are facilitated by the largest smart contract network in Crypto, Ethereum. This will be our focal point for next week – make sure you’re following all our social media channels so you don’t miss anything. We’ll be reacting to your thoughts and feedback on our Twitter and we’re releasing some additional supporting content on our YouTube.
If you don’t want to miss a beat, get involved with our Trading Community at Decentrader for regular analysis from Filbfilb and PostiveCrypto. We’re running our free trial over the festive period, or you can secure long term access with one of our subscription packages!
Thanks for reading – Miffy
Disclaimer: Nothing within this article should be misconstrued as financial advice. The financial techniques described herein are for educational purposes only. Any financial positions you take on the market are at your own risk and own reward. If you need financial advice or further advice in general, it is recommended that you identify a relevantly qualified individual in your Jurisdiction who can advise you accordingly.


 Subscribe