Market Update: The Return of The Bull: Part 2.
In my previous market update, we discussed an expectation that Bitcoin would retest the 20 WMA and would need to find demand there to remain bullish.
This is indeed what happened, a significant bid was placed below the 20wma and with no one left to sell, with a double bottom at the end of a falling wedge and a significant build-up of liquidity above, there was only one direction price could take, as shown in the below chart;

BTCUSD 12 Hour chart with Decentrader Liquidity and Funding Indicator
Note: Liquidity indicator available as part of the Predator package, or The Decentrader Toolkit
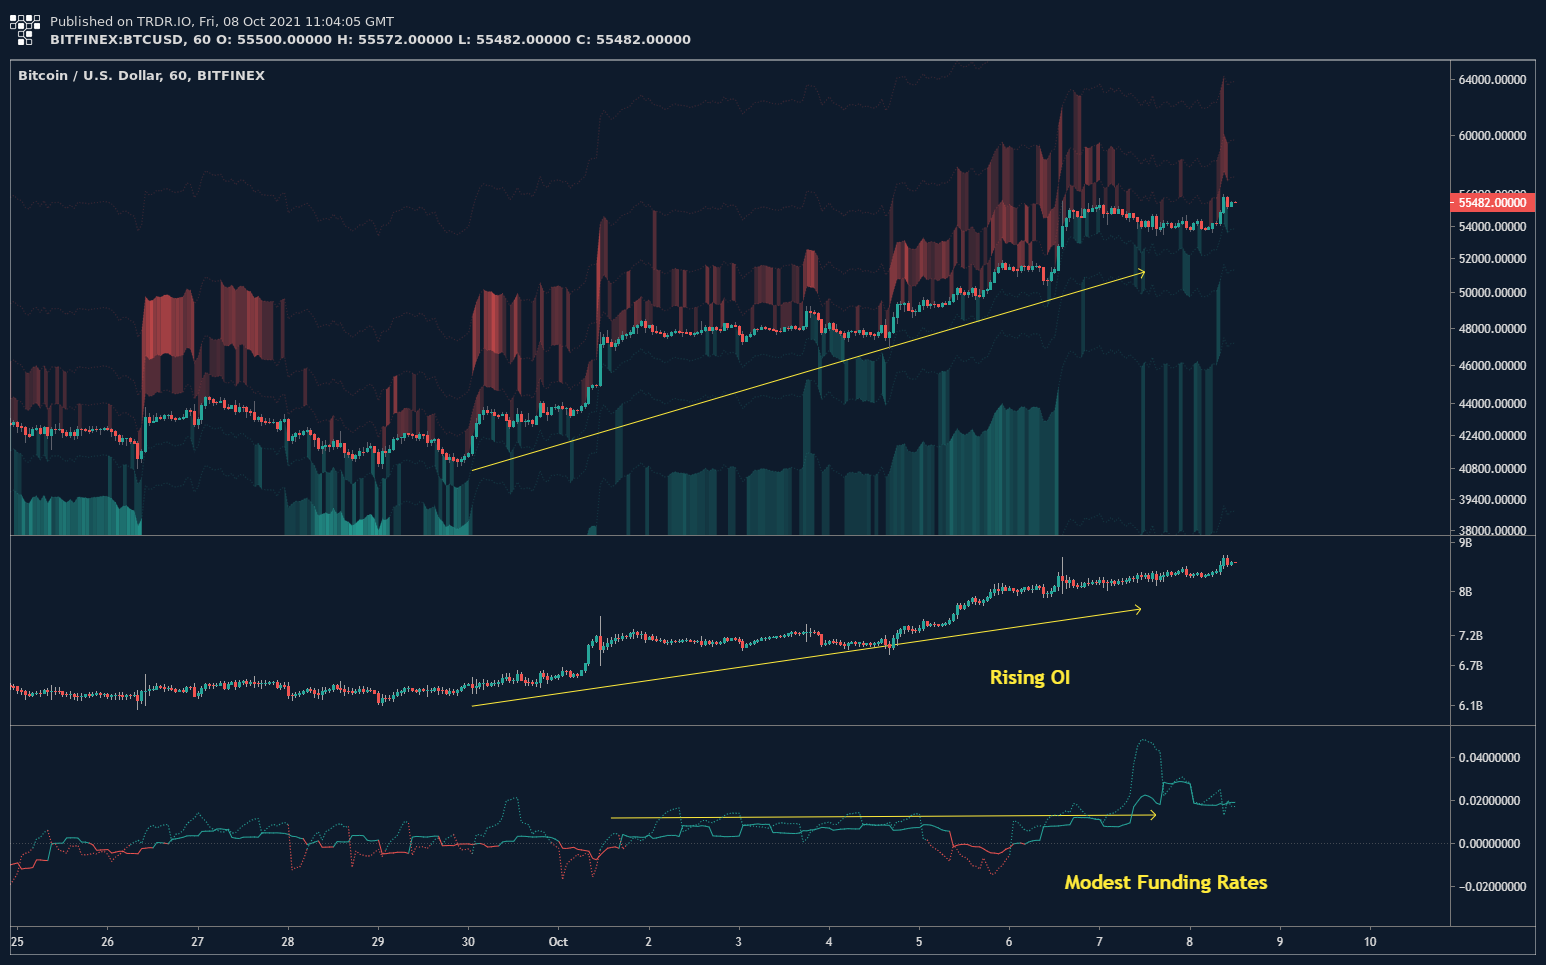
Open interest, alongside modest funding rates and a deep bid, meant that the bulls were able to push prices higher while the bears continued to add to their inevitable demise as can be seen in the below chart.

BTCUSD 1 Hour chart with TRDR – Get Access TRDR Here
The liquidity stacked above 53k was something that we shared both with members and on my telegram channel, shortly before bulls took advantage and liquidated a sizable portion of the remaining bears, taking us to 55.5k; this being significant as it closed here and confirmed the breakout above the prior swing high.
Moving forwards
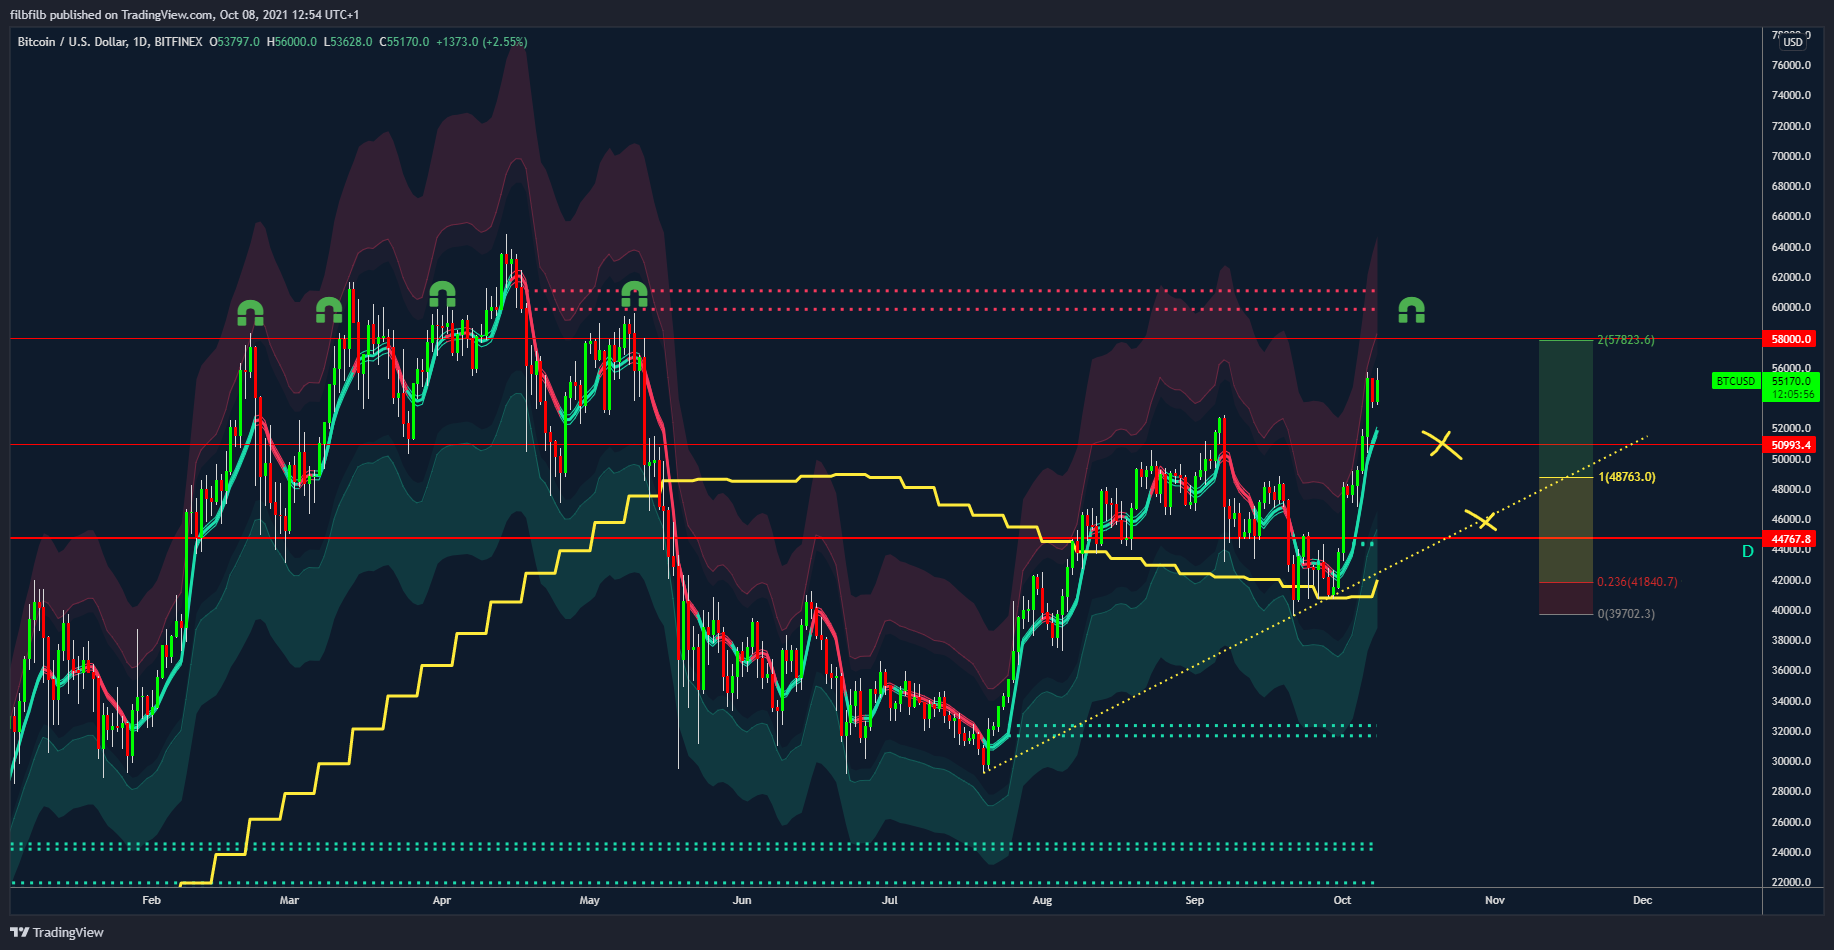
The below chart shows that in each previous instance that Bitcoin has broken $53k, the move continued higher until around $58k, with a few of the instances hitting as high as $59-$60k where we also find the resistance drawn by the Decentrader Moonraker indicator.

BTCUSD 1 Day chart With Moonraker overlay – Get the Moonraker Indicator Here!
As such, we are expecting a continuation to around $58k in the near future, where resistance is likely to be found. Similar to previous events, we then saw a correction back to retest the $50-1k level, which we are again anticipating. It is worth noting that corrections back to significant levels like $50k in this instance often do not hold up on the first time of asking, so we will be observing price action around here as prices could fall back slow as $45k as we saw in February of this year.
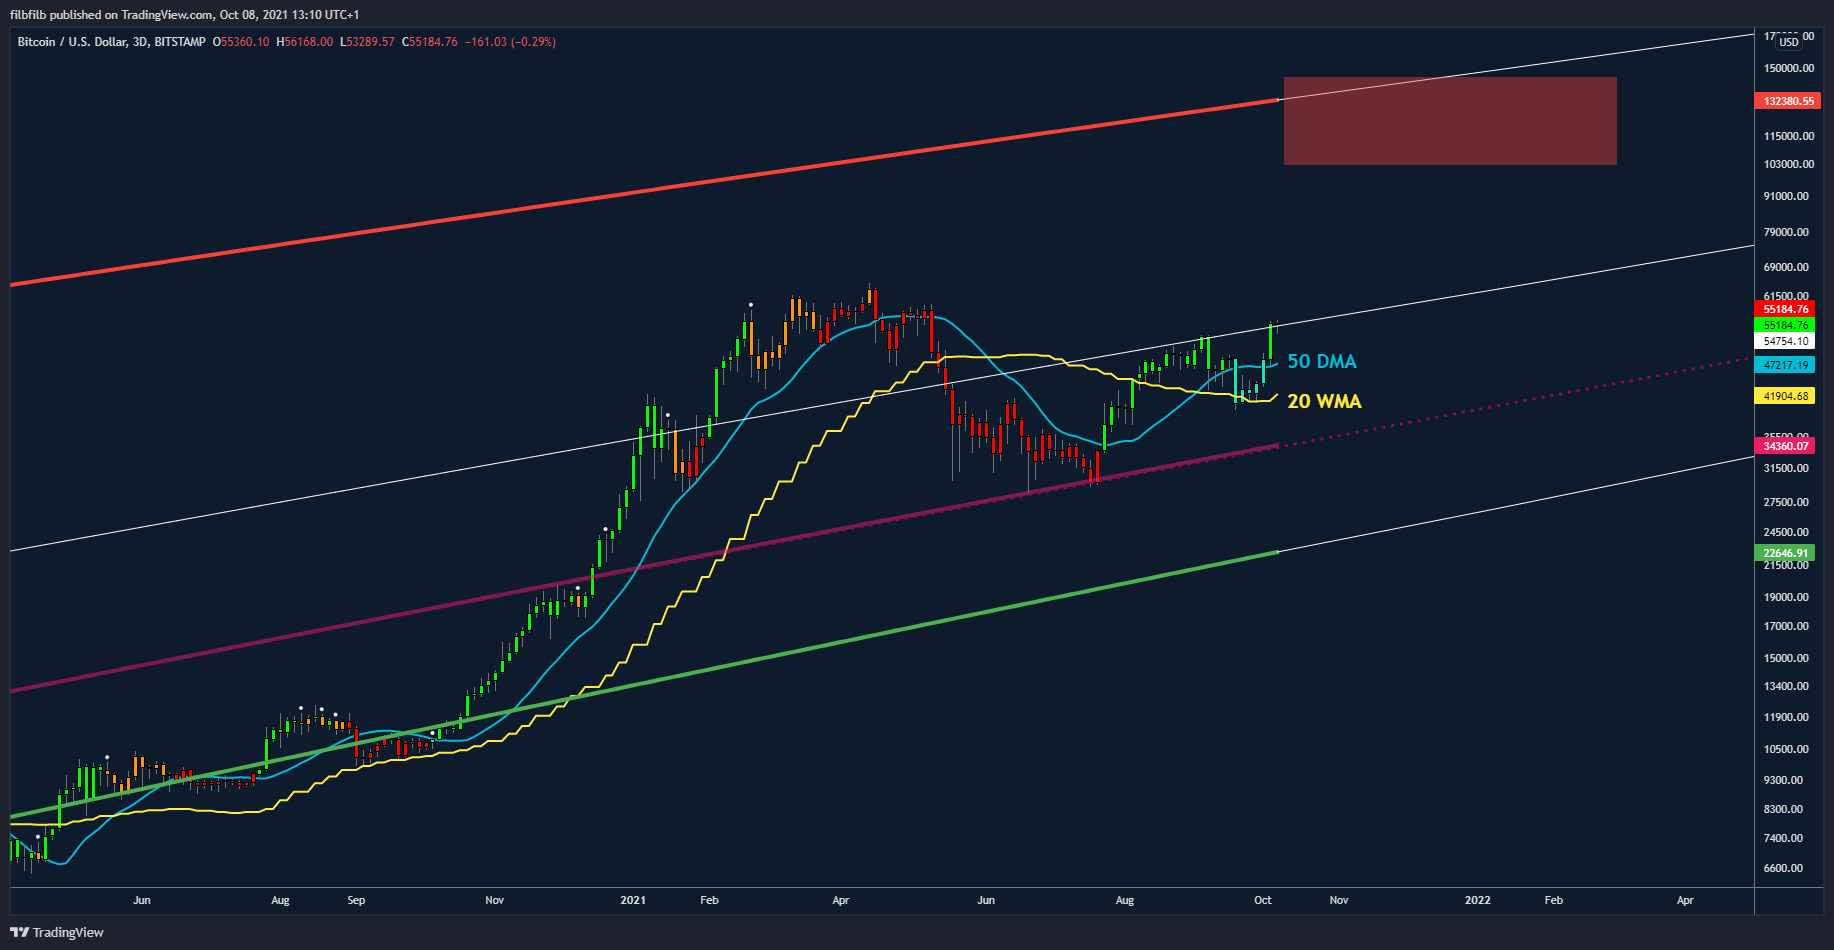
Bitcoin is firmly above the 50 DMA, along with a 3-day green predator print, which is the most bullish signal which we look for in the Bitcoin market.

3 Day Chart with Predator indicator overlay
Did you know? You can now trial the Predator Indicator for 4 months for $400. Click to get it now!
While these conditions remain true, alongside increasing open interest and modest funding rates, we maintain our price targets being significantly higher, towards the top of the logarithmic growth curve, with there being acceleration once a new all-time high is established, which will most likely bring retail back into the market and send Bitcoin on towards the $100k level late Q4 2021 / Early Q1 2022.
Happy Trading, speak soon!
Disclaimer: Nothing within this article should be misconstrued as financial advice. The financial techniques described herein are for educational purposes only. Any financial positions you take on the market are at your own risk and own reward. If you need financial advice or further advice in general, it is recommended that you identify a relevantly qualified individual in your Jurisdiction who can advise you accordingly.


