Market Update: The Accumulation vs Re-Distribution Debate
Bitcoin has been trapped in consolidation for 65 days, following an 81-day distribution and the subsequent sharp decline from the $50k level.
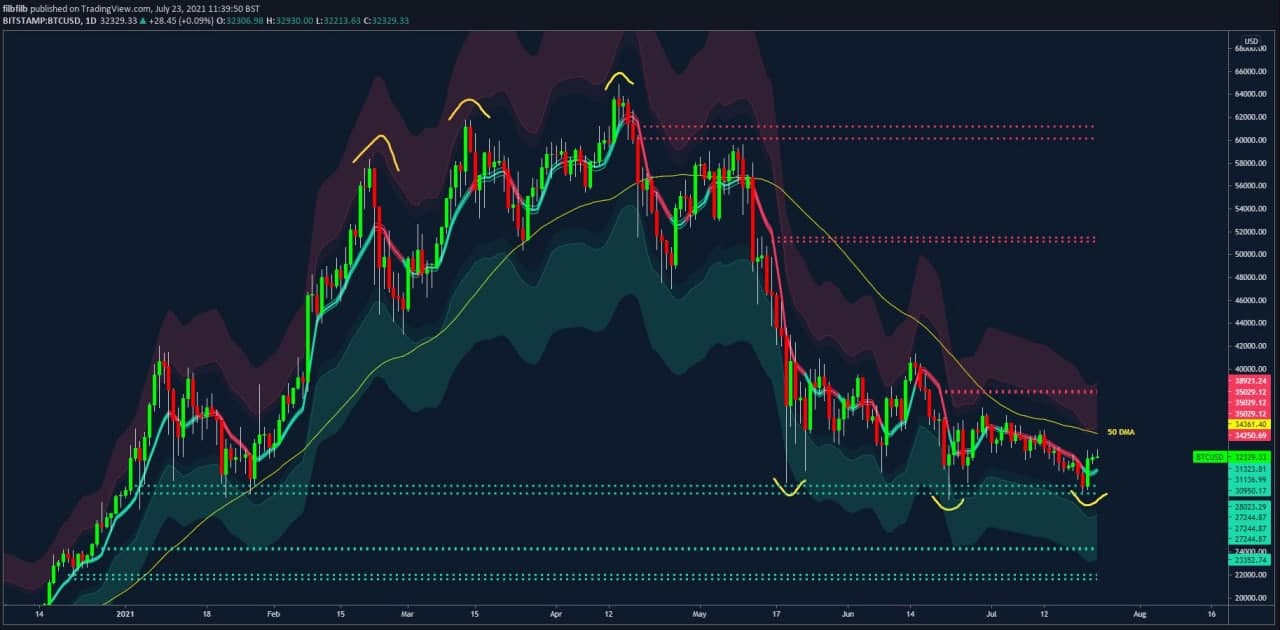
After a rather aggressive selloff last week with a concluding push into support at the 29k level on Monday, support was indeed found and the price reverted back into the rage retesting 32k on negative funding rates.
https://www.tradingview.com/x/QwmCMRgn/
Fig. 1 BTCUSD 1 Day Chart with Moonraker indicator showing support/resistance.
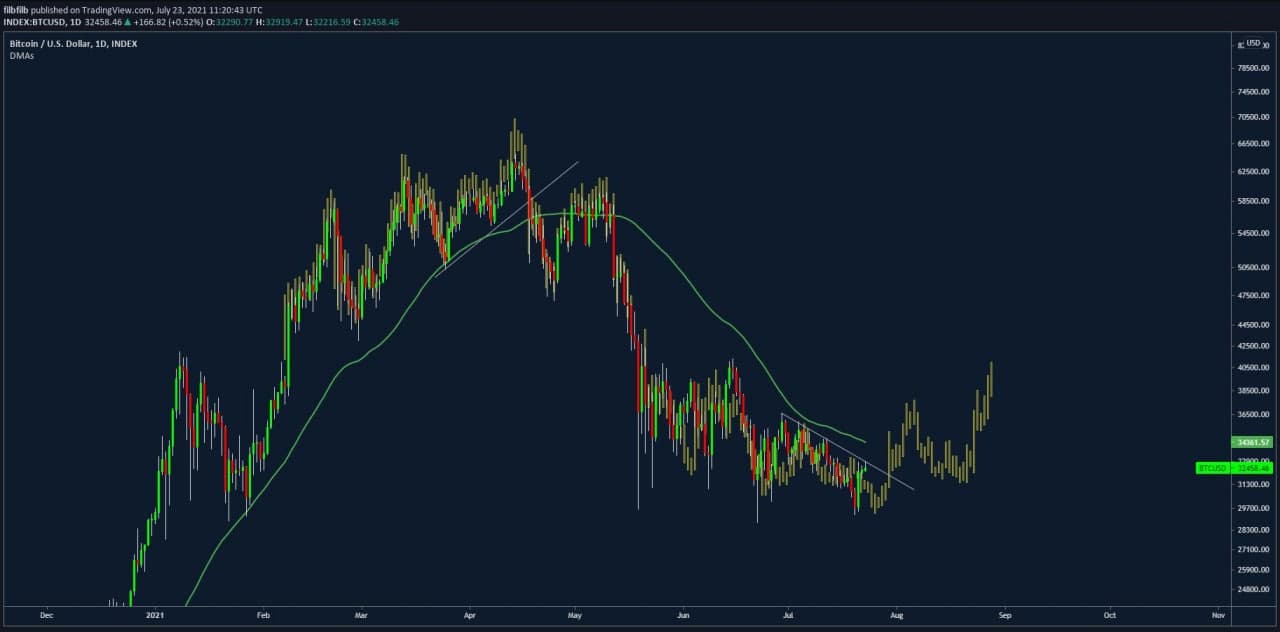
As mentioned previously, we were expecting a reasonably lengthy consolidation following the similarly lengthy distribution and significant drawdown, with there being some parity between the two in terms of length of time.
The below chart shows the distribution inverted/mirrored with the current price action which shows some remarkable similarities.
https://www.tradingview.com/x/dxjdhaae/
Fig. 2 BTCUSD 1 Day mirror; credit to @BTCfeen
Accumulation or Re-Distribution
There have been many Wyckoff arguments made around if the current price action is currently that of reaccumulation or redistribution, with reasonable arguments being made on both sides. The top was almost textbook distribution and on an inverted basis alone without bias to drawing accumulation schematics, there is a reasonable case that Bitcoin is Reaccumulating.
Environmental Setting
The world climate at the moment certainly lends itself to Bitcoin having a strong use case from an anti-inflationary standpoint, the issue around sovereign money and privacy all of which has become more of a discussion point for everyday folk, particularly in the wake of tracking and tracing citizens, discussion of Central Bank digital currencies and so on.
These issues being brought to the forefront are likely to be bullish for Bitcoin in forthcoming months as citizens consider the real implications of the topics discussed, however, we also have seen a barrage of the onslaught of crackdowns on Exchanges, China bans on mining Environmental FUD, etc; to this extent, crypto stands in the face of some of these intentions and could be considered bearish on this basis.
Consequently, the Bitcoin market is slightly more difficult to consider at this point, particularly after a long sustained drawdown at this point in the cycle that we have become accustomed to and having arrived on the world stage as a 1 Trillion USD asset (albeit intermittently across a few months).
On Chain
Some on-chain metrics around network usage show that the bitcoin network is displaying properties we have seen at end of the cycle such as the number of active addresses falling off a cliff, following a capitulation of new entrants.
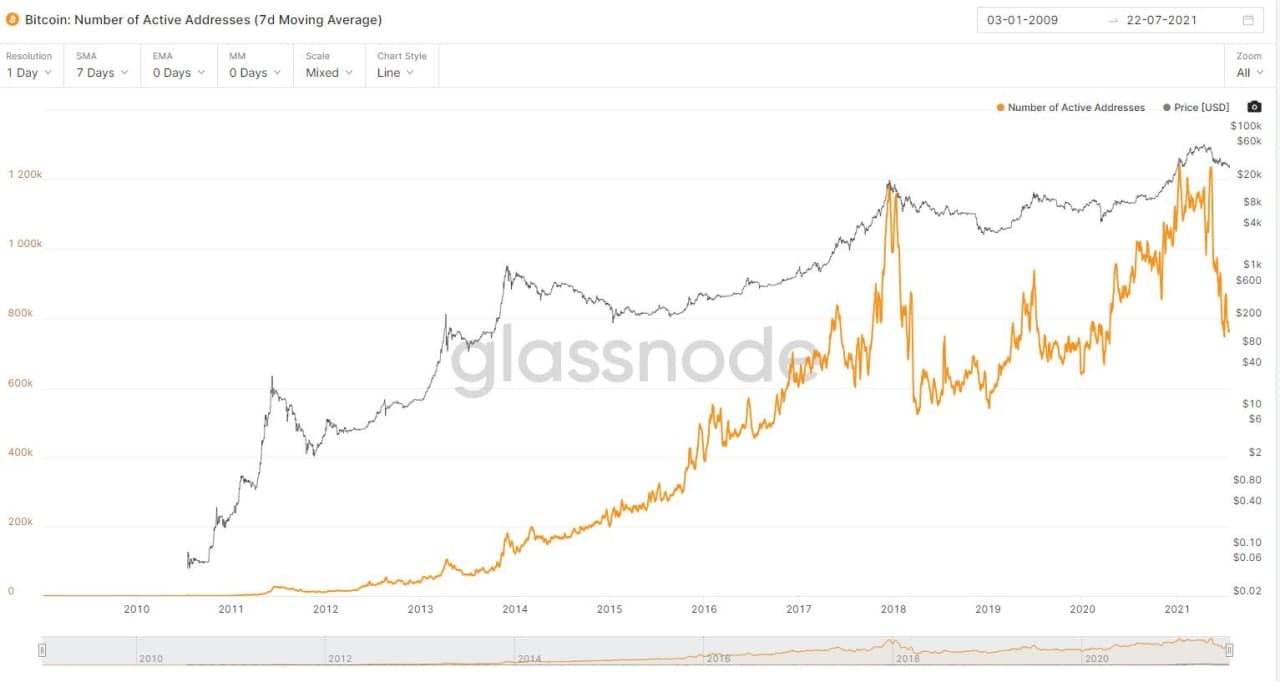
Fig 3. 7 Day moving average of active addresses. Source – Glassnode
However, we also have the number of participants holding coins for >1 year being roughly the same as in previous cycles at around 50% meaning that despite there being some capitulation of the late entrants, the cyclical hodlers are still holding their position for higher prices, with a fall of around 10 percentage points usually distributed in the final part of the cycle at much higher multiples.
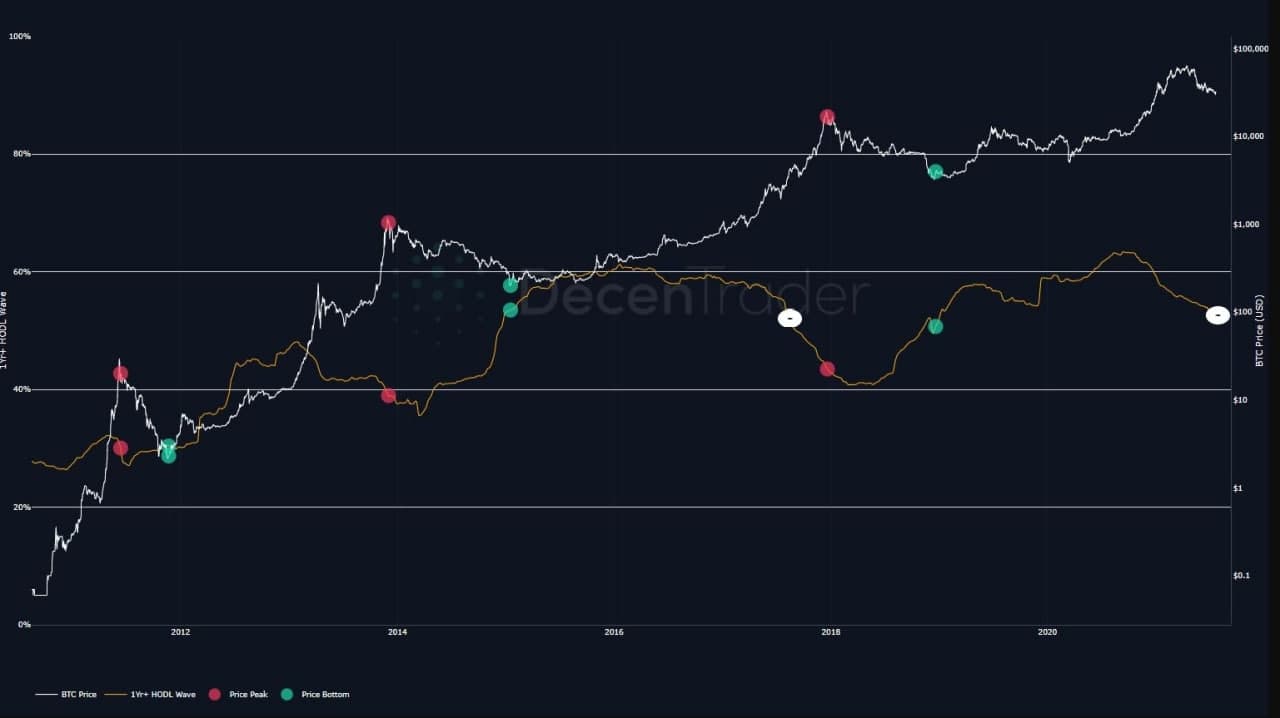
Fig. 4. – 1Y+ HODL Wave
This foreign dynamic in the market, with cyclical hodlers having not been tested below these relative prices in the cycle, its easy to see why the market is particularly choppy at the moment, with emotions running high.
Finex whales
There has also been a large position being accumulated at Bitfinex, which shows an increase in leverage of over 300% up to 42k longs to a total of 57k leveraged longs which has been accumulated since around $30k. This lends itself to there being high conviction whales long in the market who are happy to accumulate, however also brings risk associated with leverage.
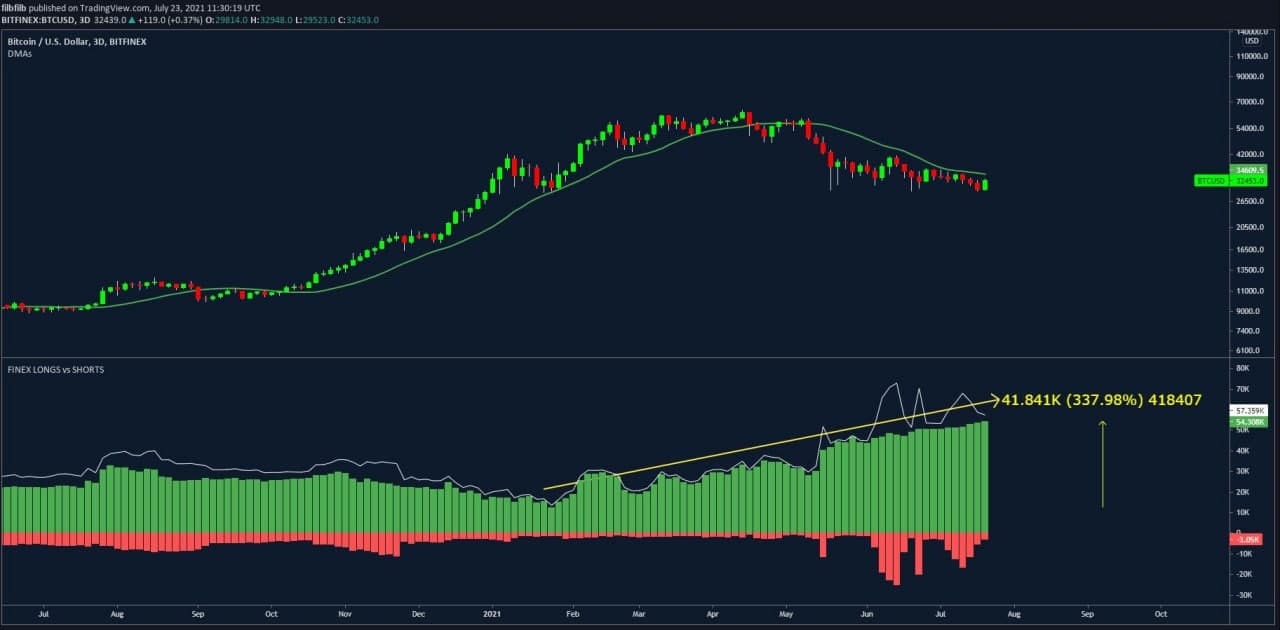
Fig. 5 BTCUSD Bitfinex Longs and Shorts
Bullish or Bearish?
Generally, in light of the conflicting on-chain and general geopolitical environment, we are being cautious about taking on bigger positions until some conditions are met. We see support at the $22k and 24k level should there be a breakdown below the current support level, but let’s take a look at what’s needed before we get really bullish in the Bitcoin market once again;
The 50 DMA as shown in fig 1 shepherded prices both up and down in the previous move. It has also been quite a distinctive line in the sand in previous consolidations which ultimately resolved bullish, as shown below.
As such a break of the 50 DMA, which is also ideally supported on the daily timeframe, will be one condition we are looking to meet.
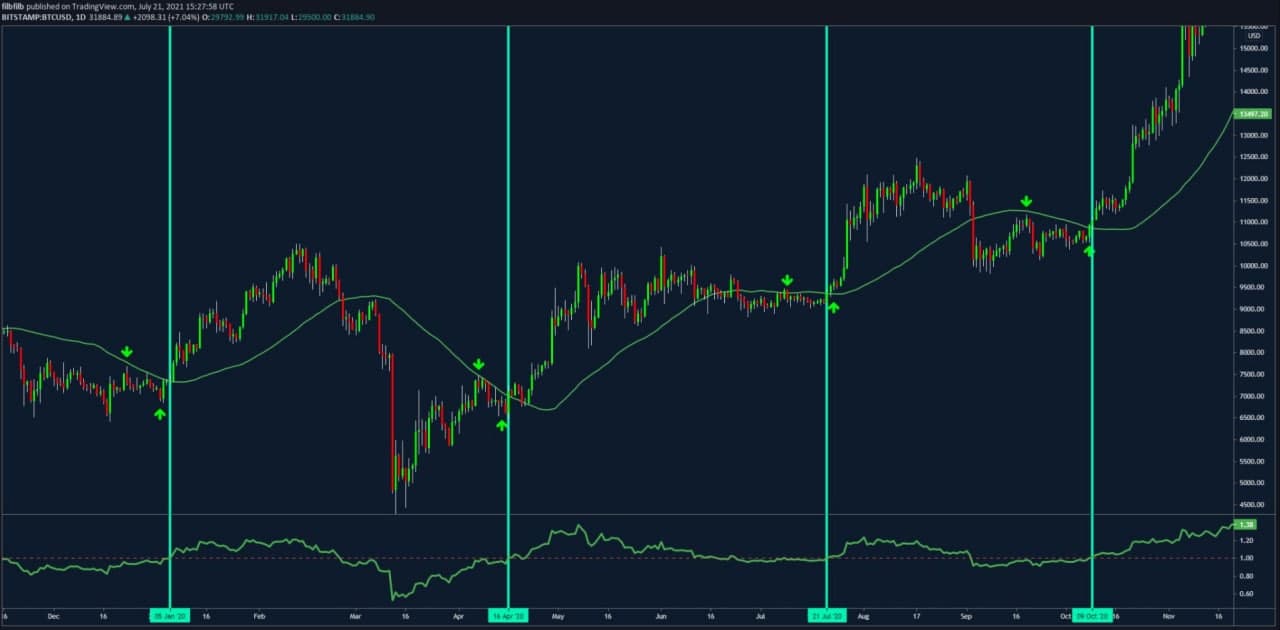
Fig. 6 BTCUSD 50 Day Moving Average – https://s3.tradingview.com/snapshots/b/bROgE0ig.png
3 Day Predator Indicator & Volume
The predator indicator combined with the 50 DMA has been particularly useful in identifying breakouts from consolidation. This system takes into account several variables including volume and as such designed to support volume-based moves.
Also looking at average consolidated spot volume, we can see that additional confirmation can be found alongside the aforementioned to support the entry thesis.
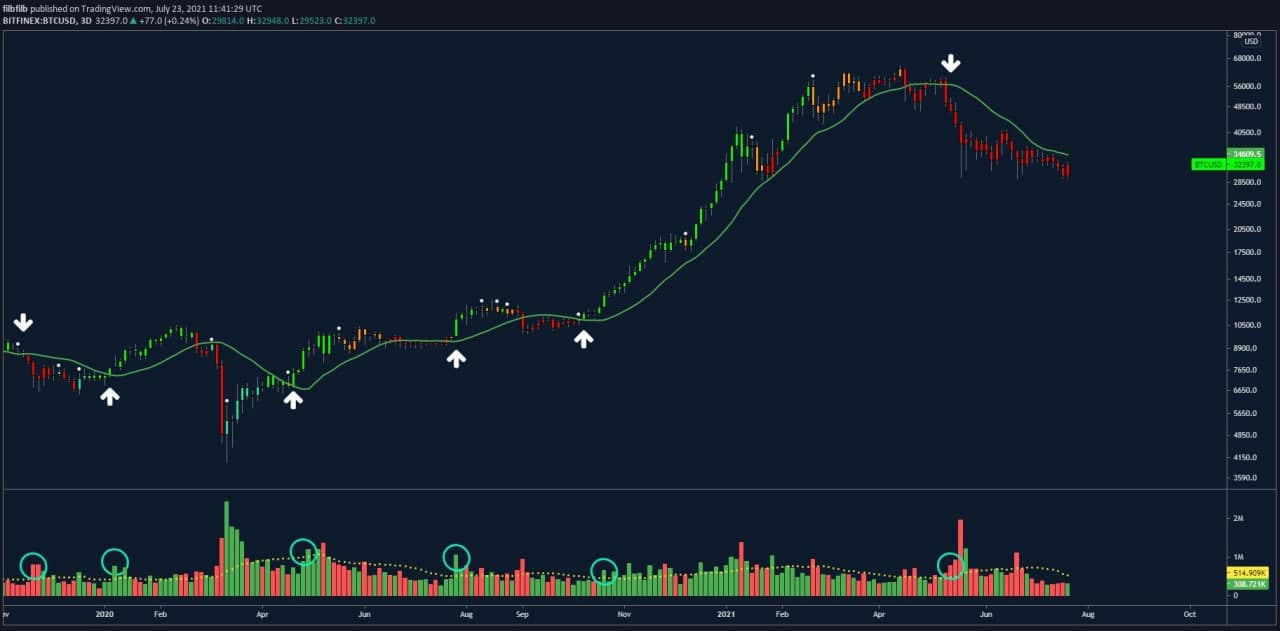
Fig. 7 3 Day Predator Indicator & Volume – https://www.tradingview.com/x/fzvTvrIm/
You can purchase predator HERE.
1 Day Moonraker (MR) Support
Finally, we are looking to see Bitcoin close above the MR mean line which is part of a mean reversion strategy which we employ once the market is trending to remain in the market as long as possible at spot.
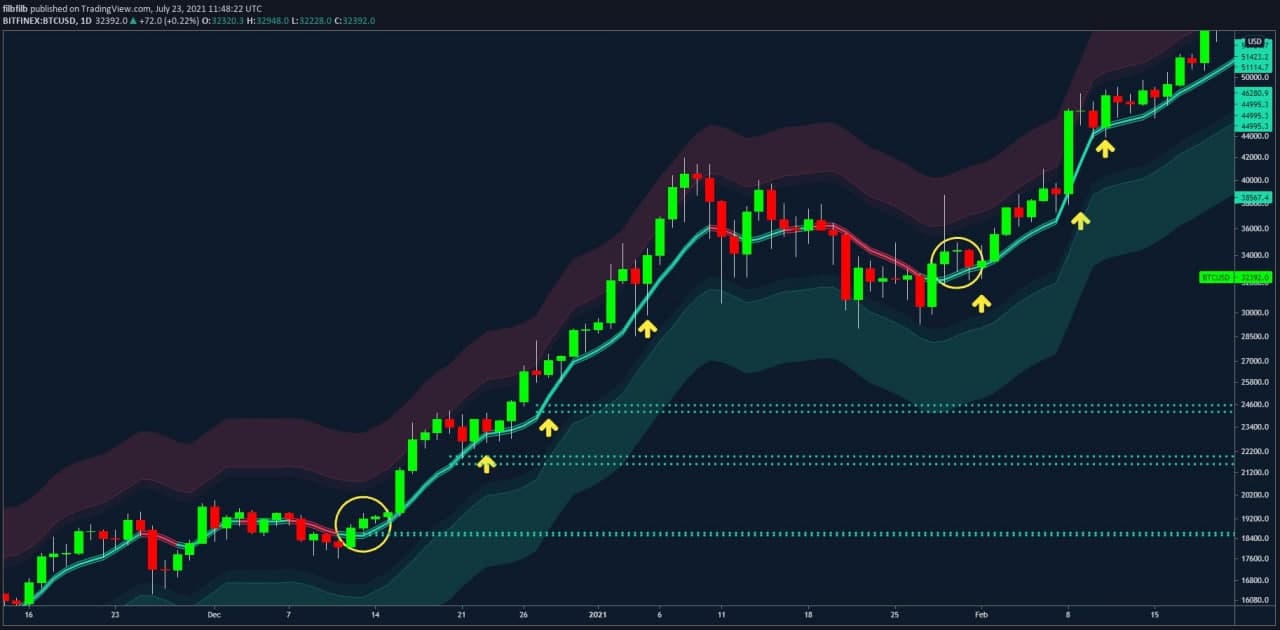
Figure 8: Moonraker indicator highlighting trend breakout, mean reversion and, key support and resistance levels at $22 and $24k for Bitcoin.
https://www.tradingview.com/x/mukrSP63/
Purchase Moonraker Indicator Here!
Once all of these conditions are met, we will be a lot more confident that Bitcoin is back on track to move to the upside, however as you may have noticed, none of these conditions are currently true, hence the cautious approach.
Good luck in the markets and happy trading!
Like what you read? For the regular market analysis and live streams with PositiveCrypto and FilbFilb, join us HERE.
Disclaimer: Nothing within this article should be misconstrued as financial advice. The financial techniques described herein are for educational purposes only. Any financial positions you take on the market are at your own risk and own reward. If you need financial advice or further advice in general, it is recommended that you identify a relevantly qualified individual in your Jurisdiction who can advise you accordingly.


