Market Update : Pi Cycle Top Indicator and the new Commando Tool
One of my Bitcoin live charts has been getting a lot of attention on social media the past couple of weeks. So I thought I would share my point of view on it here as I give a market update for Bitcoin.
The Pi Cycle Top Indicator is a live chart hosted on the Decentrader website that notes when previous market cycles for Bitcoin have topped out.
The past three times that the 111DMA (orange line) crossed up above the 350DMA x2 (green line) it signaled a market top to within 3 days. Way back in the very early and volatile days of Bitcoin, in 2011, they crossed to within 2 weeks of the top.
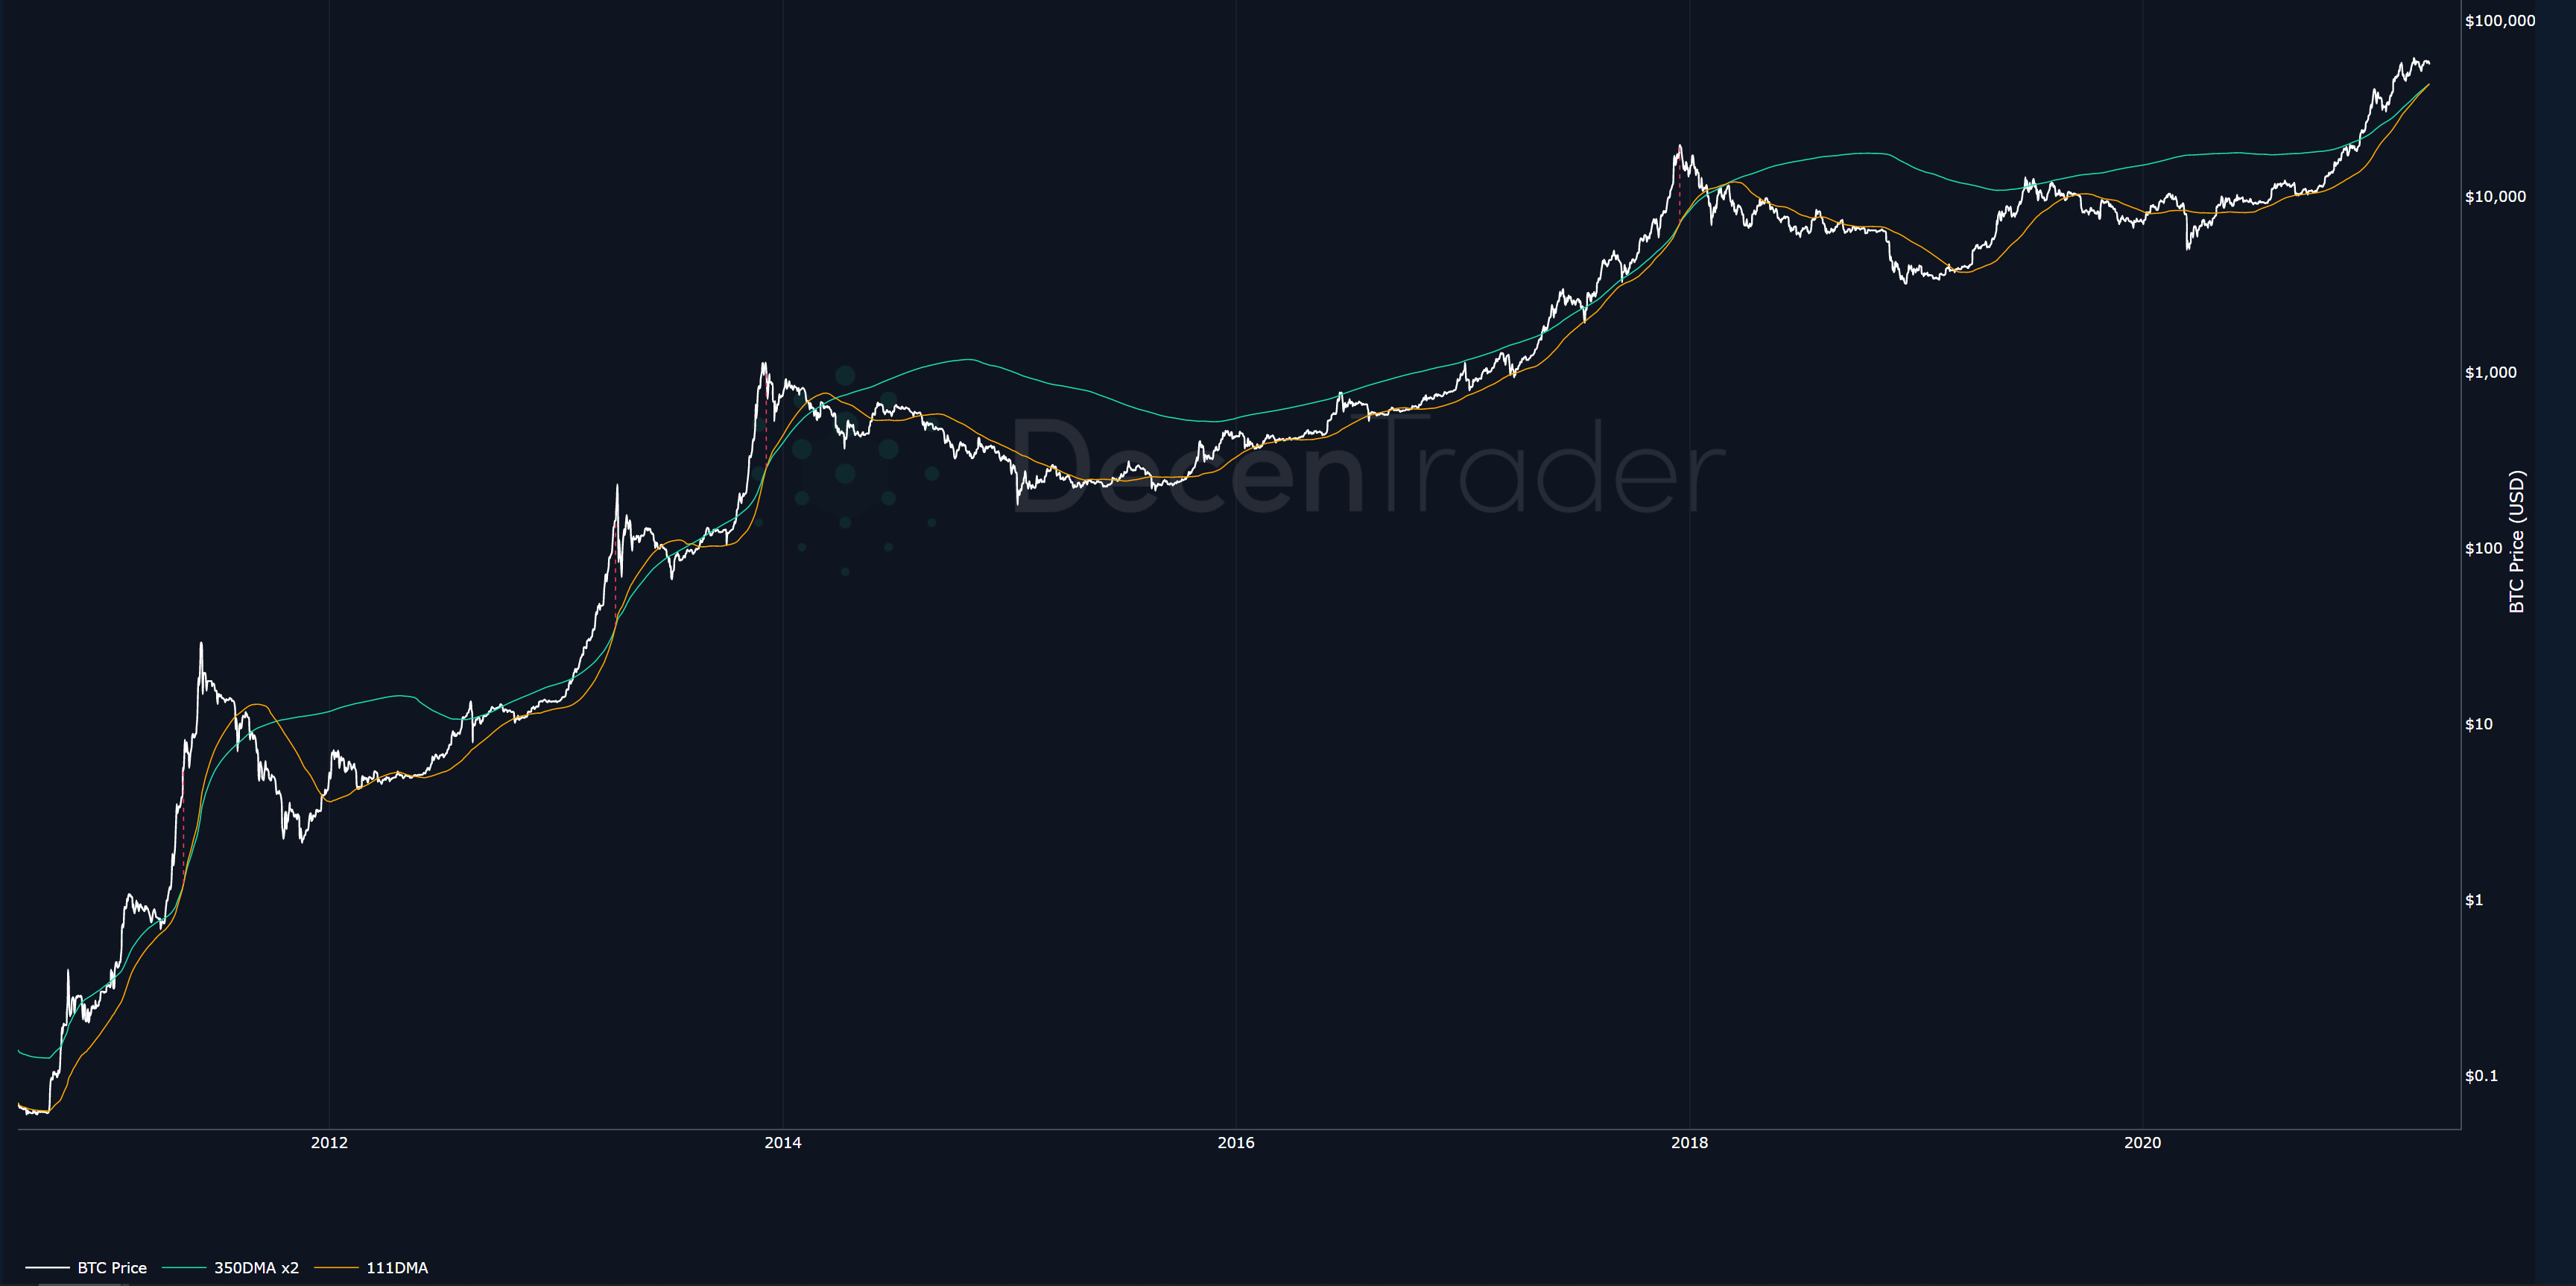
Figure 1: Pi Cycle Top Indicator
In some way, historically the indicator has captured the cyclical nature of Bitcoin as it has moved through a broader adoption curve.
It’s called the Pi Cycle Top indicator because 350 / 111 = 3.153 which is pretty close to Pi, 3.141.
Zooming in we can see that the 111DMA (orange line) is once again about to cross up above the 350DMA x 2 which suggests the market could top out *IF* the same pattern that we saw in previous cycles repeats:
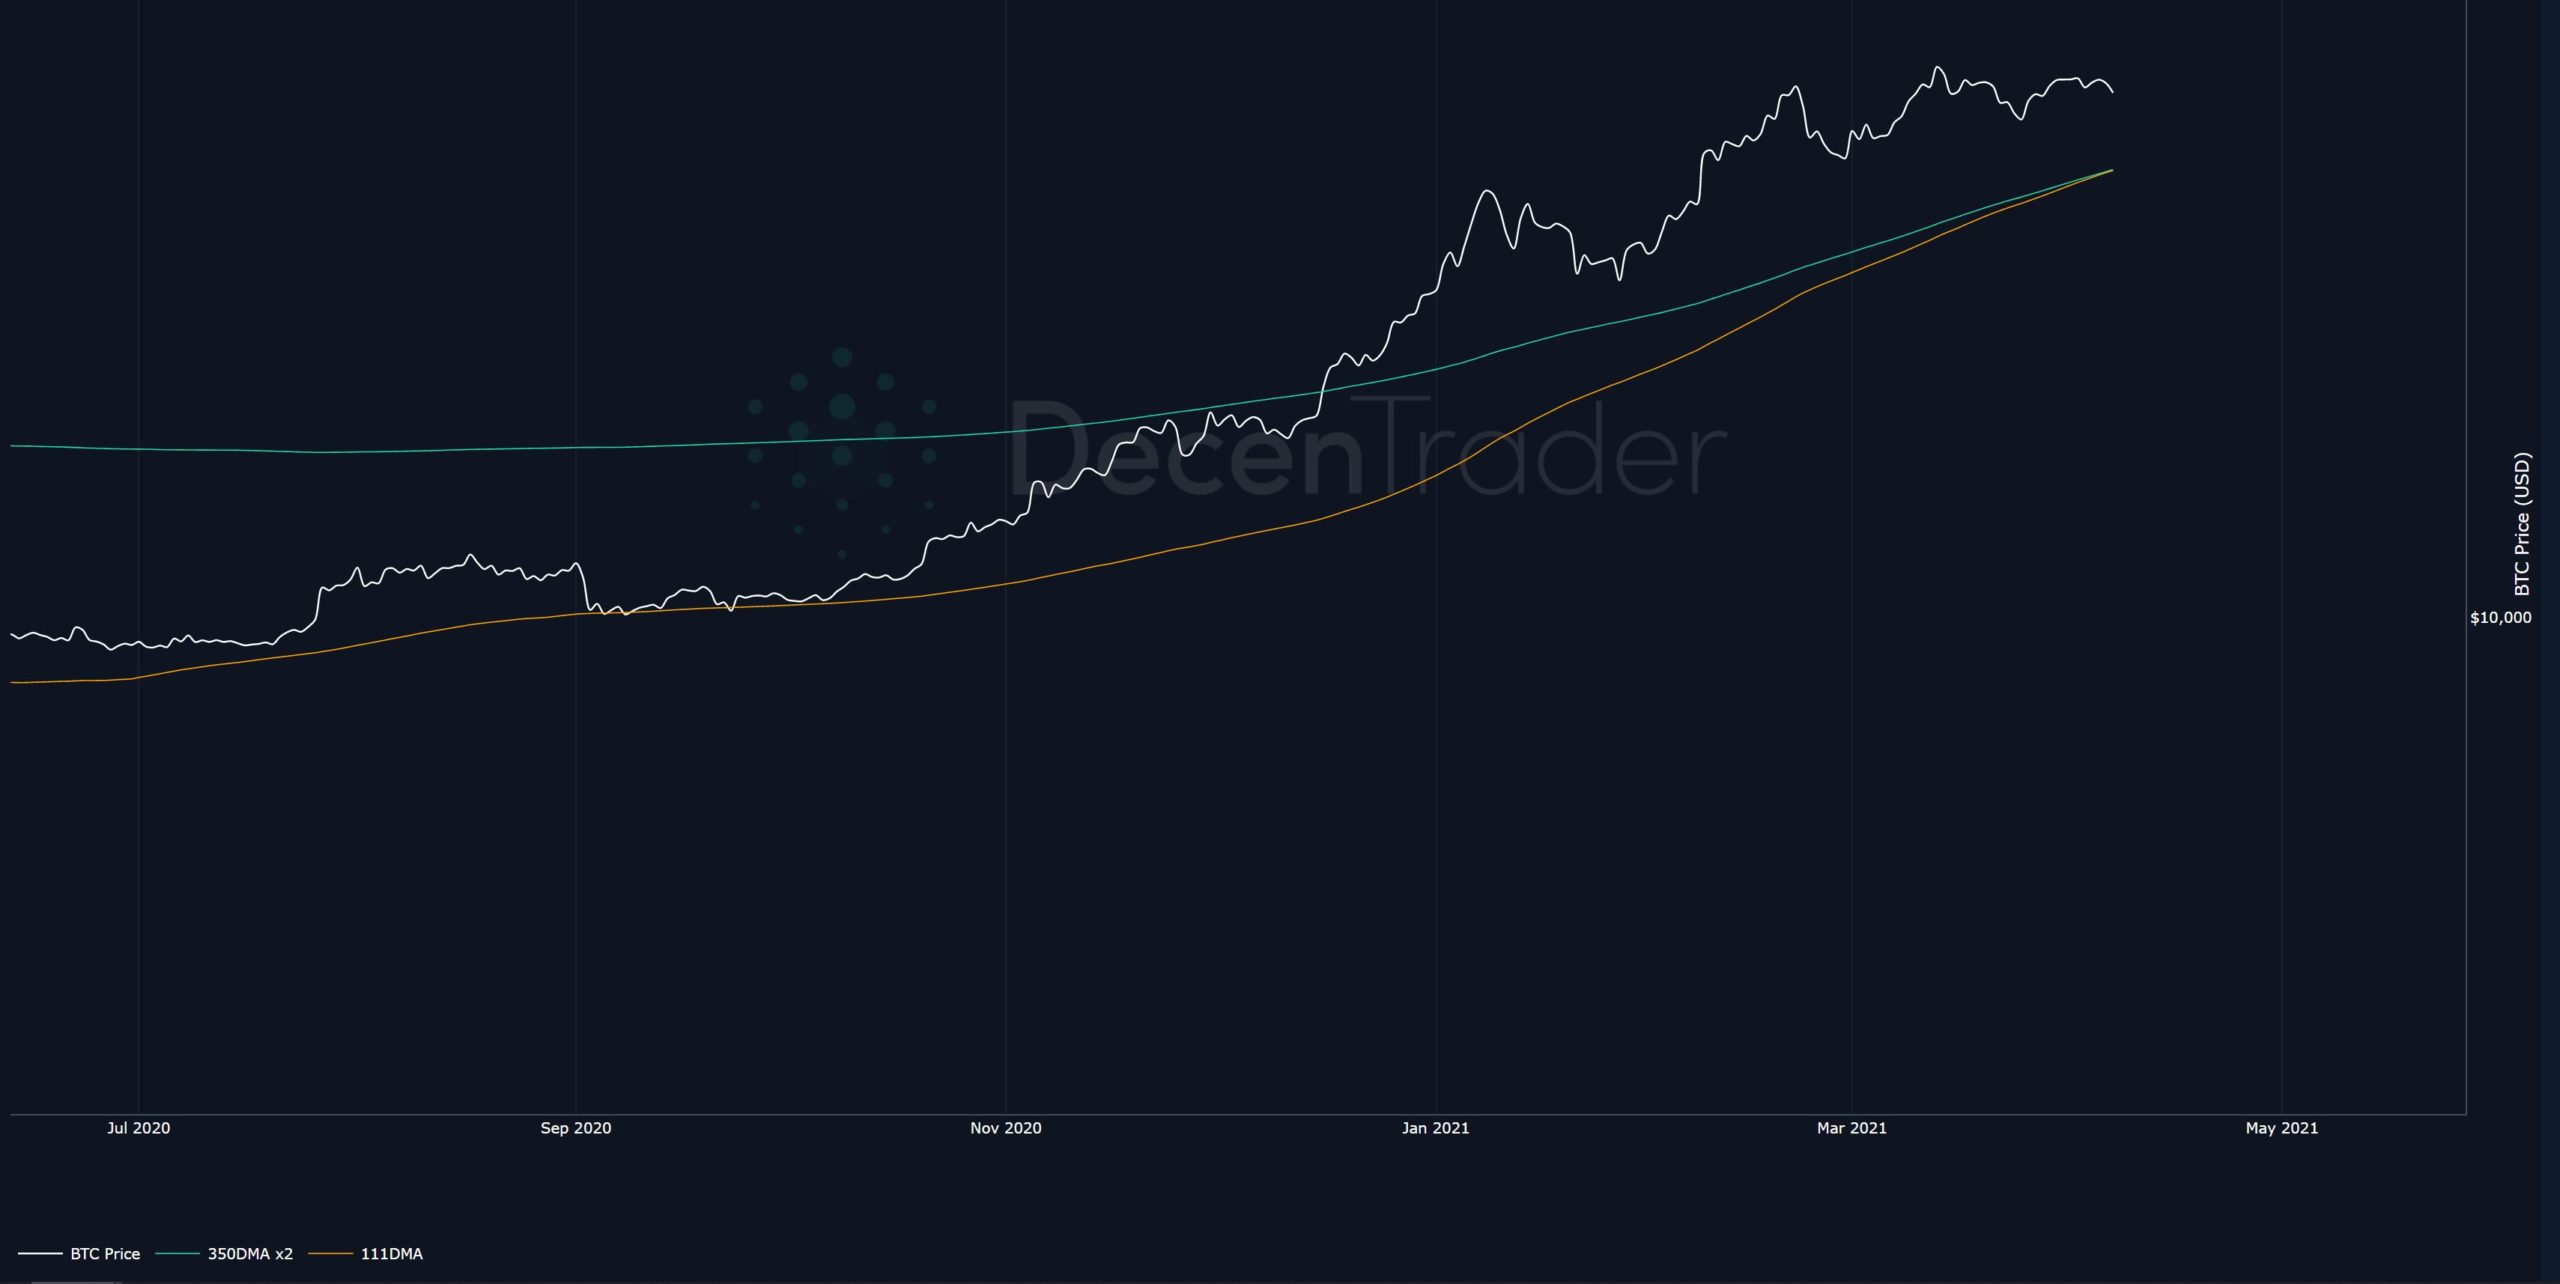
Figure 2: Pi cycle top key moving averages about to cross
So is the price of Bitcoin about to crash?
My opinion
My current near-term market outlook for Bitcoin is neutral-bullish, so my personal view is that there is a good probability this is not the market cycle top for Bitcoin when the Pi Cycle Indicator moving averages cross in a few day’s time.
Other indicators and fundamentals are suggesting that we are not yet at the end of the market cycle. A couple of examples…
1yr HODL Wave
The amount of bitcoin being HODL’d for over a year remains much higher than we would expect for the final stages of a bull market. Currently, 55% of all bitcoin has not moved on-chain for over a year, suggesting that many HODL’ers are not prepared to sell their bitcoin until we see much higher prices…above $100k and beyond.
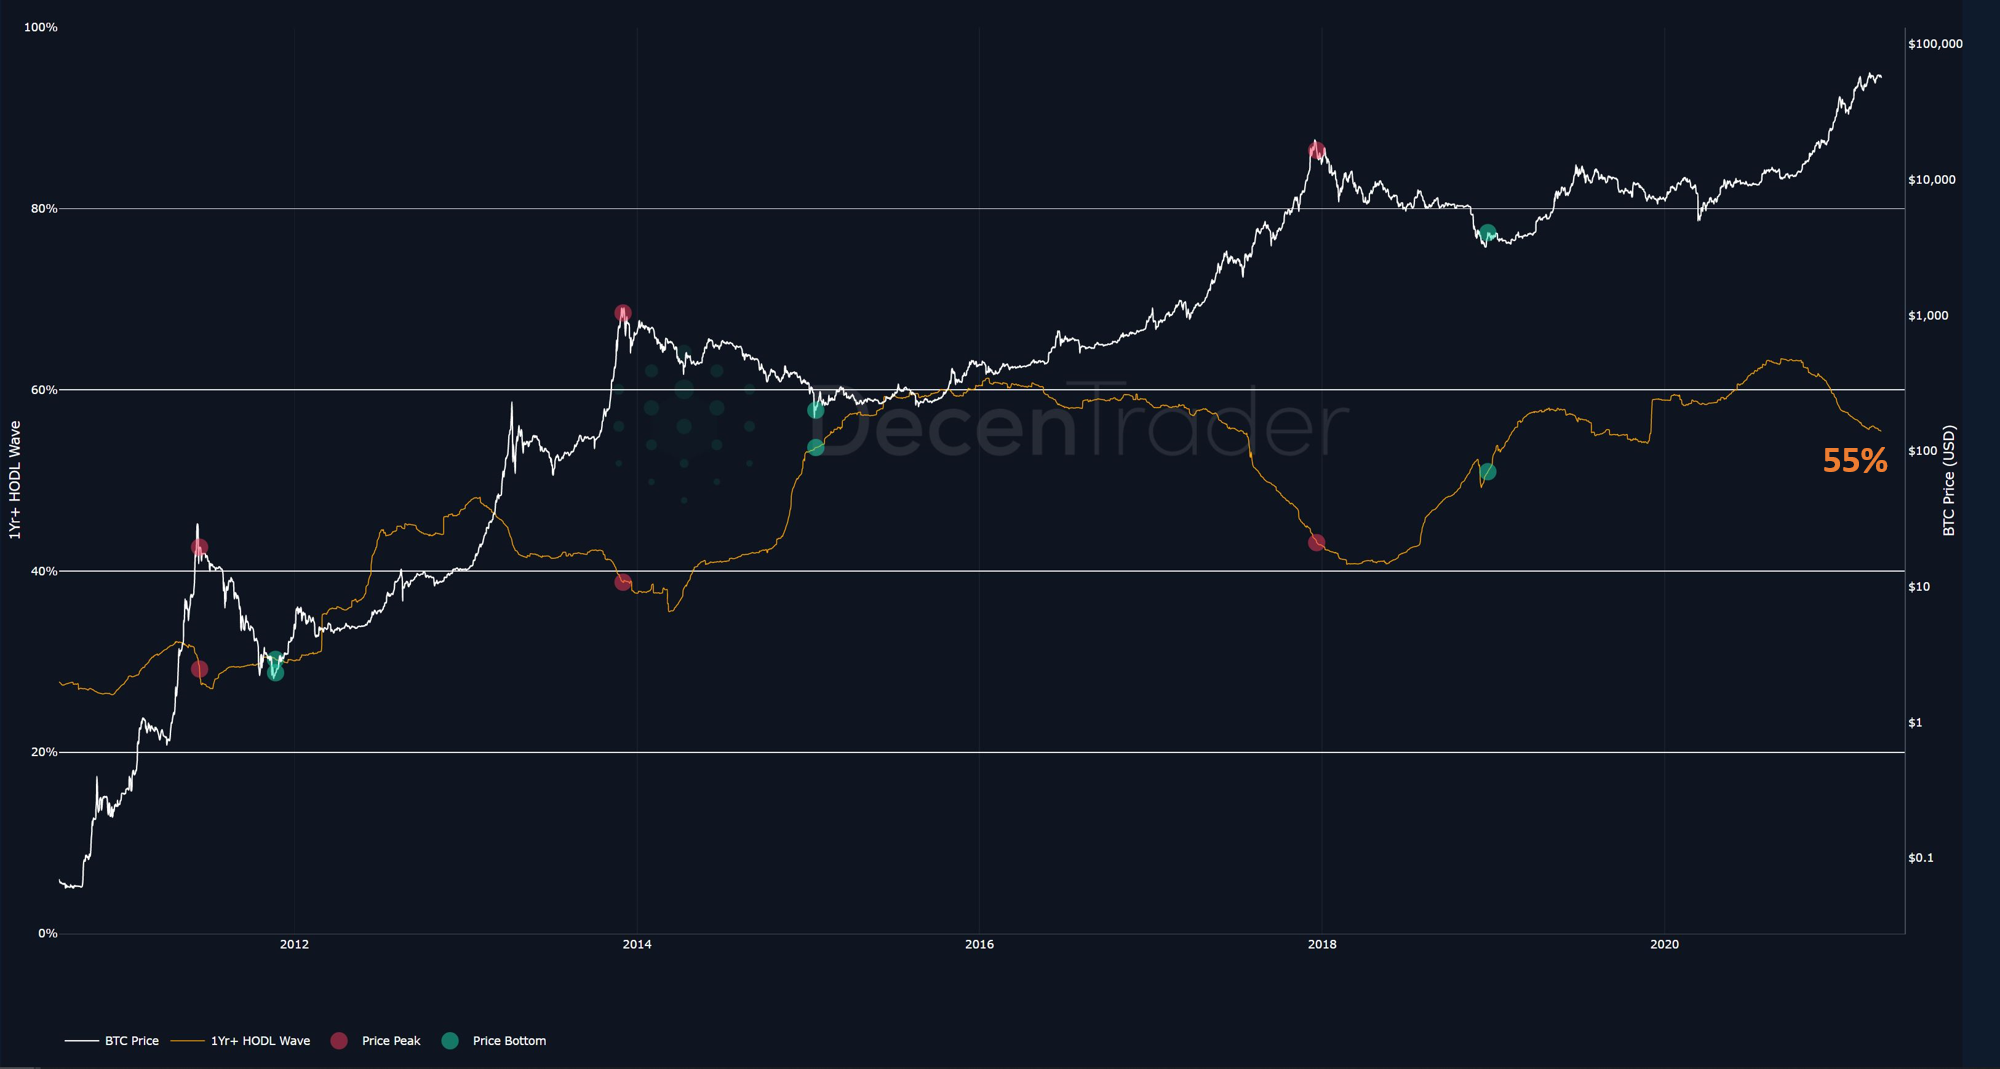
Figure 3: 1yr HODL rates still up at 57%
Based on market psychology that we have seen play out in previous cycles, it is likely that we will see 1yr HODL rates drop towards 47% at the final stages of the market cycle as long-term HODL’ers realize more profits.
MVRV Z-score
Another effective tool for picking market cycle highs is MVRV Z-score which looks at whether current prices are accelerating away from the average cost basis paid for bitcoins. When this happens the blue indicator enters the upper red zone of the chart below, indicating that the market is overheated and will soon top out.
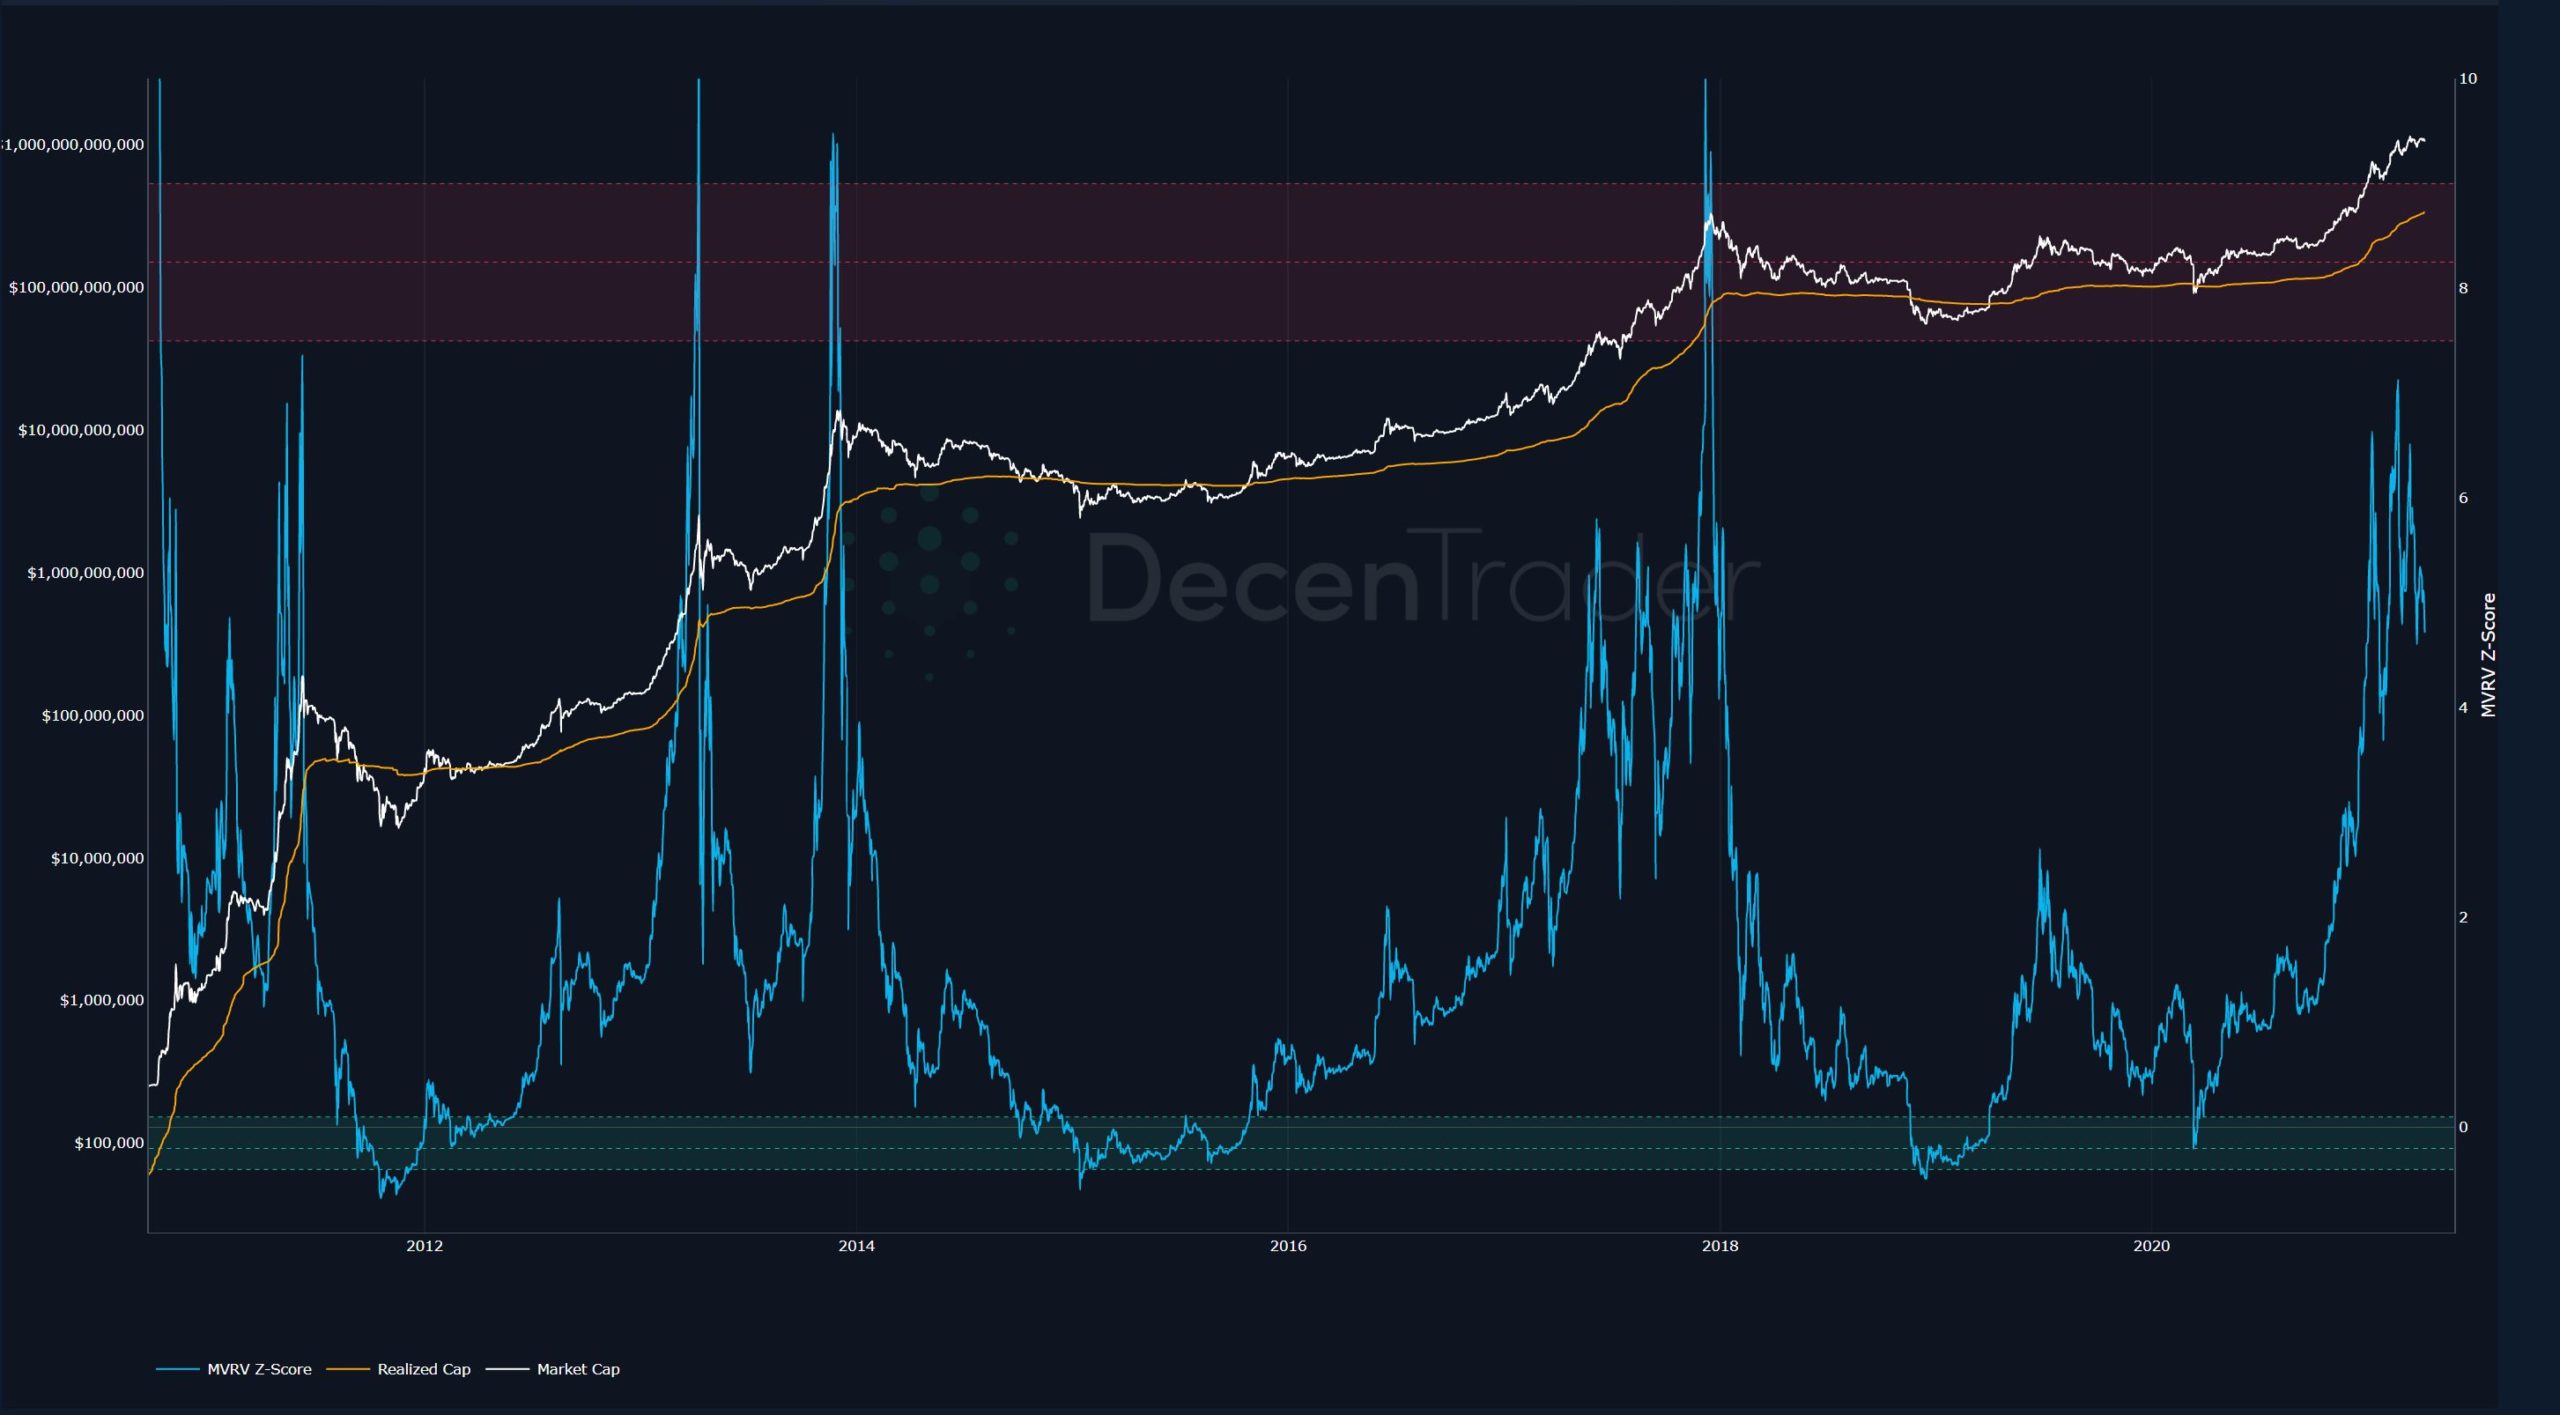
Figure 4: MVRV Z-Score: major cycle highs within 2 weeks of blue indicator entering the red zone
Currently, the indicator is consolidating in a range well below the upper red band which would suggest this is not yet the major cycle high of this market cycle.
So I am of the opinion that if Bitcoin does not continue up, it is more likely to range for a while, rather than top out here and crash into a new bear market.
Other factors such as funding rates, which broadly look quite sustainable, also suggest that there would need to be a major shock event around Bitcoin to cause a significant crash in the near term.
Personally, I am excited to see what, if anything, happens when the moving averages cross in the next few days as all these indicators are essentially experiments.
It will help us understand more about Bitcoin as an emerging asset class moving through its adoption journey.
The New Commando Tool
At Decentrader we are very excited about the release of our new Commando tool.
It is a crypto market scanning tool that has very impressive live market test results.
It scans a range of crypto assets, including $BTC and $ETH as well as a wide range of altcoins, to identify which have the potential to accelerate in price terms over the next 24hr period.
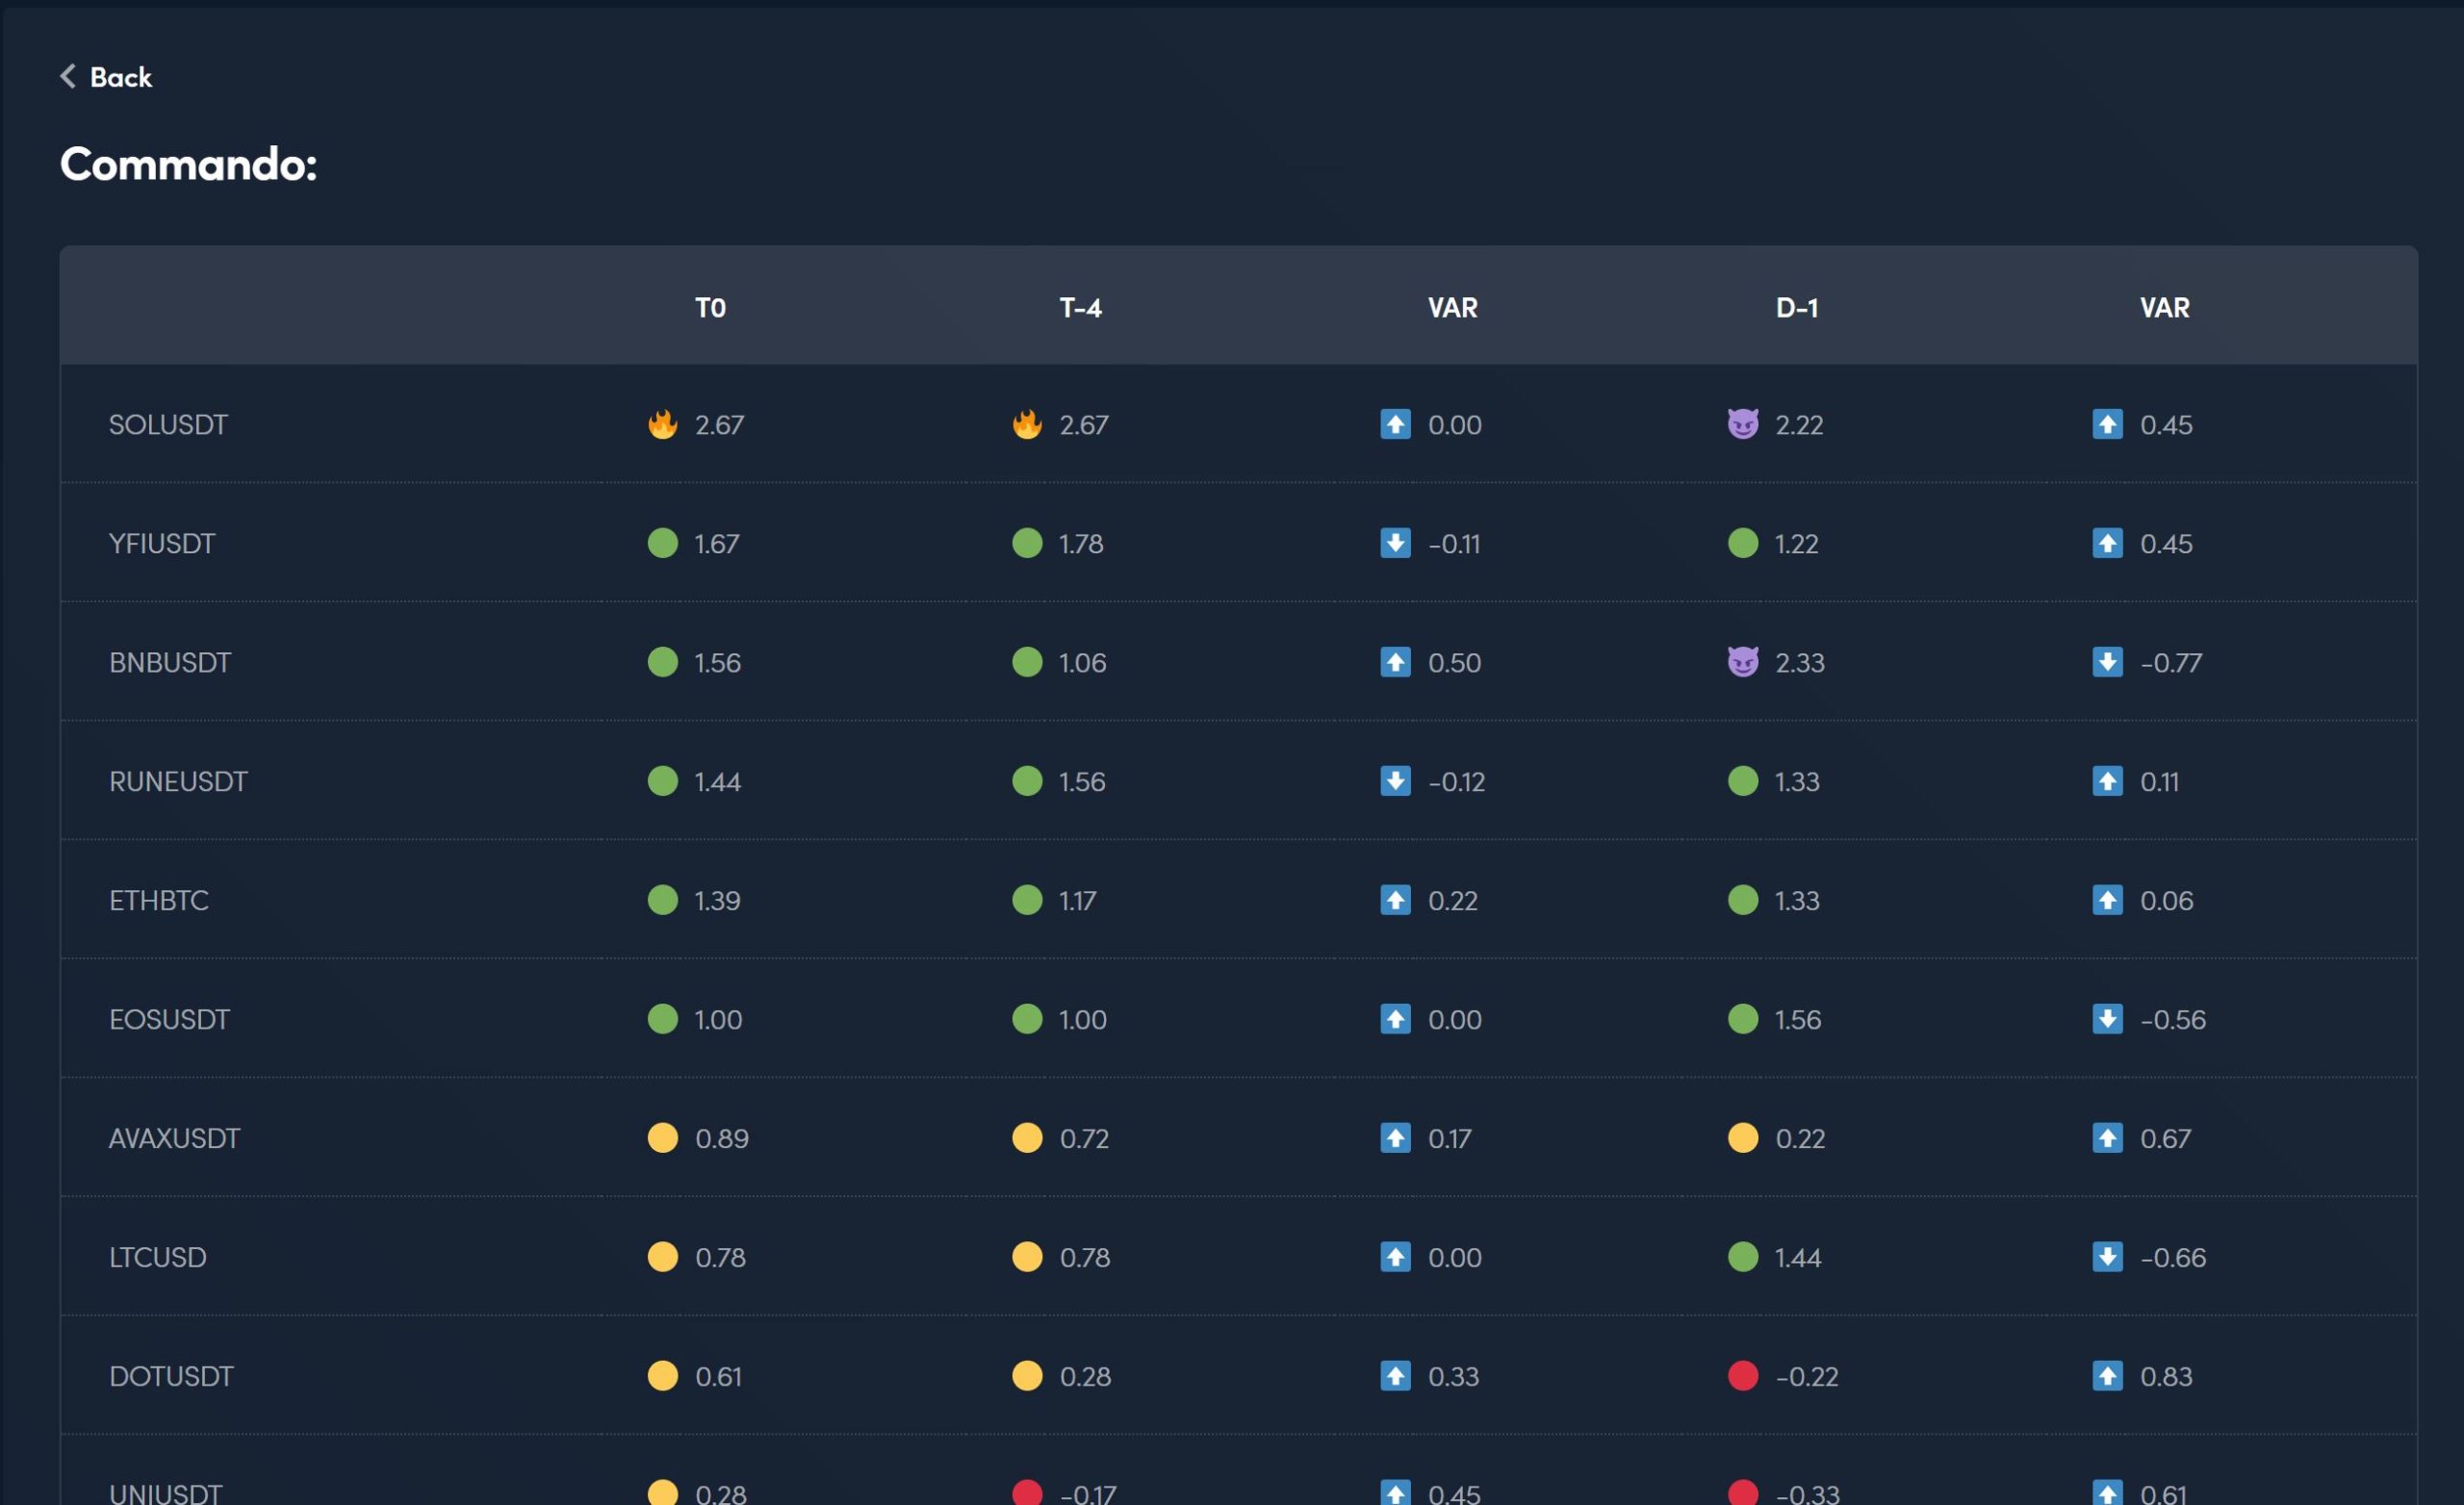
Figure 5: Commando tool scans over 20 crypto assets and we are constantly adding new ones to the dashboard
When Commando reaches a score of +2 there is a 78% probability of price increases on that asset within the next 24hrs, with an average price increase of +3% in that time.
Such a consistently high success rate presents a strong opportunity for taking long trades.
The most recent +2 score was for SOLUSDT yesterday, which was up +8% a few hours later at the time of writing this update:
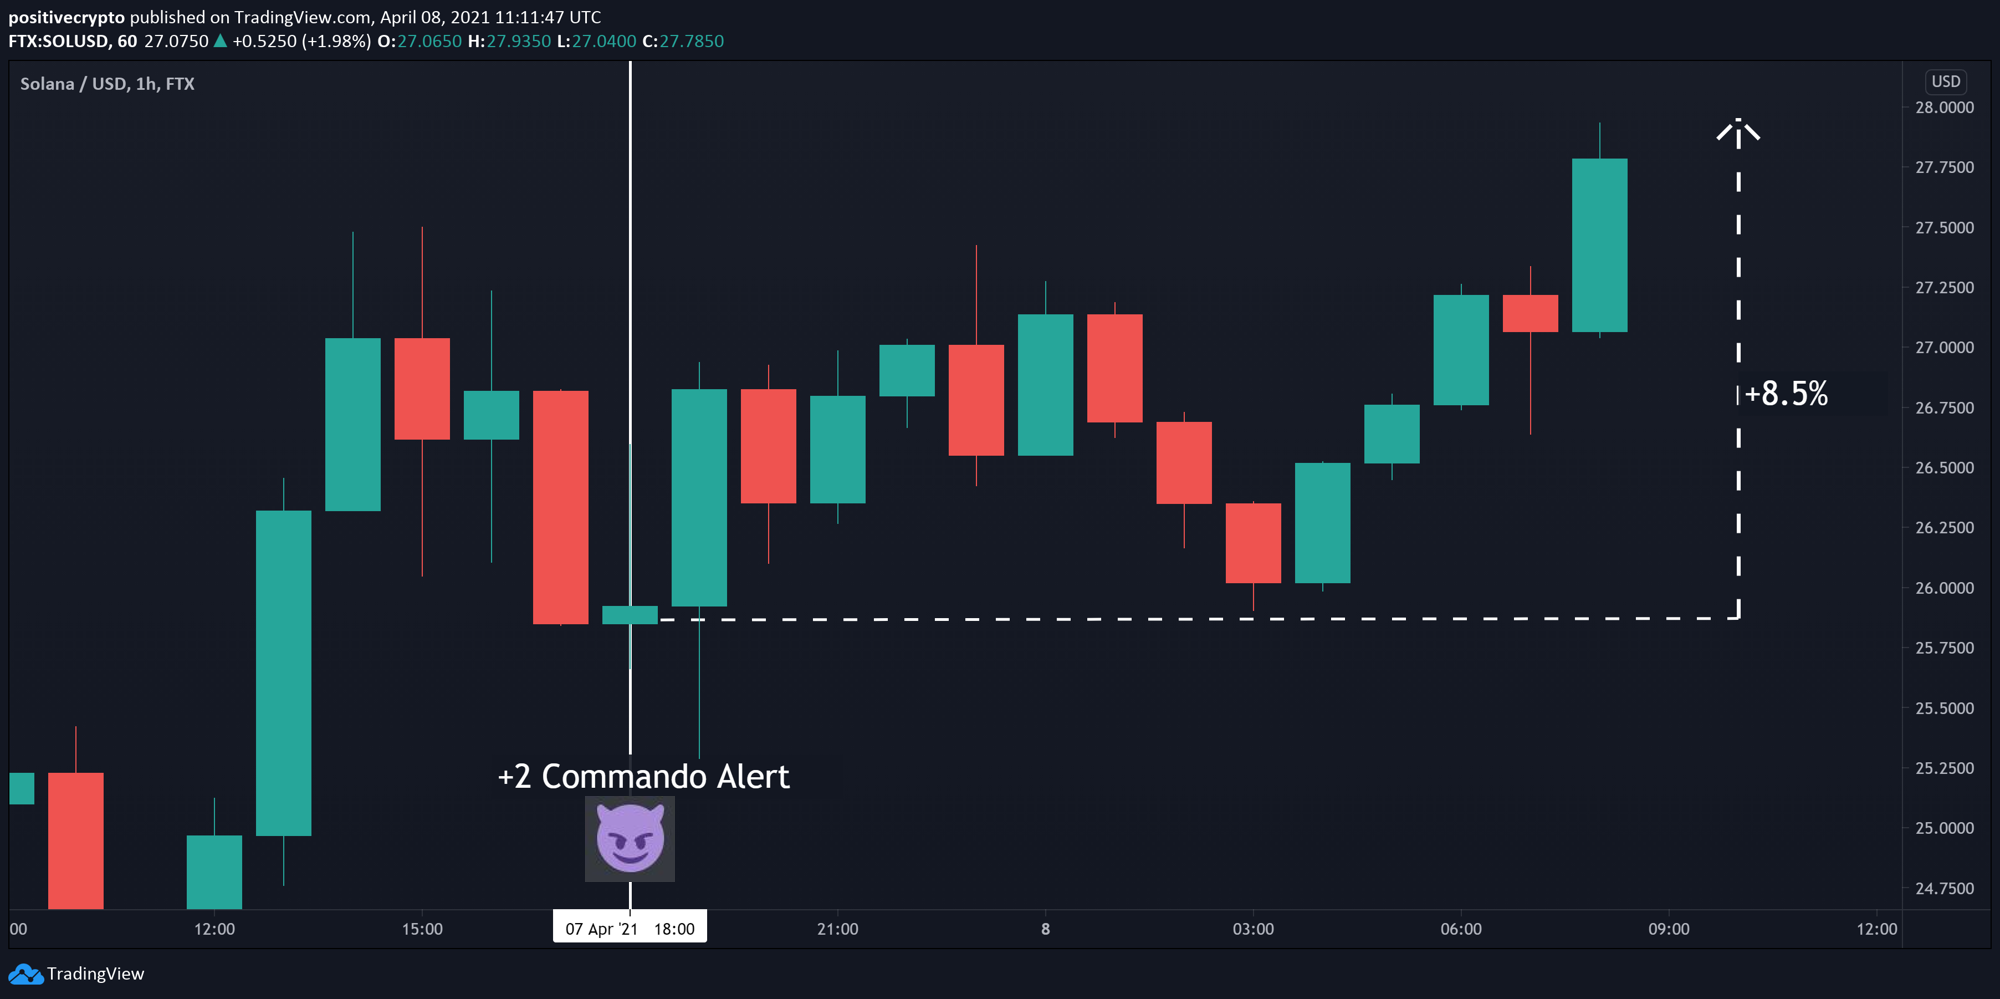
Figure 6: SOLUSDT price action after the +2 score Commando alert
Commando scans the market and allows traders to find the best opportunities in seconds…instead of having to spend hours looking at each coin’s charts.
It is available exclusively to our VIP members.
To learn more about Commando and get access, head over to the Commando page on the website.
Until next time.
The Decentrader Team
Disclaimer: Nothing within this article should be misconstrued as financial advice. The financial techniques described herein are for educational purposes only. Any financial positions you take on the market are at your own risk and own reward. If you need financial advice or further advice in general, it is recommended that you identify a relevantly qualified individual in your Jurisdiction who can advise you accordingly.


