Decentrader Market Update – Bitcoin & Ethereum – 28.05.2021
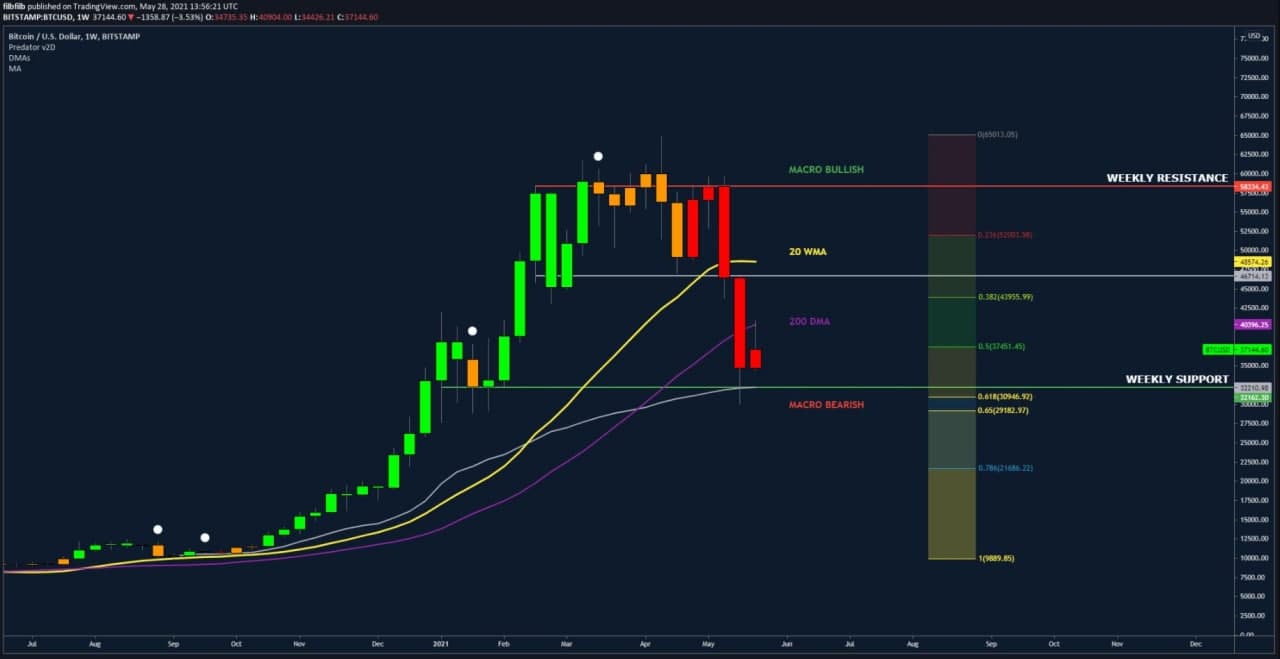
Bitcoin’s Bounce from the 61.8% bull market retracement which briefly saw a retest of $30k has been muted by the 200 Day Moving Average (DMA) around $40k this week.
Price action is some way from the 20 Week Moving Average (WMA) which is typically the line between Bitcoin being either in a bull or bear market and as such remains a bearish scenario for Bitcoin.
Should Bitcoin find sufficient demand in the low 30s, the 20 WMA would be expected to act as resistance. A drop lower would likely make the low $20s or the 78.6% retracement a likely target. As such, price action over the next week particularly important.
https://www.tradingview.com/x/704CaPyu/
Figure 1: Bitcoin Weekly Chart – Top identified by Predator Indicator
You can access the Predator indicator here.
Bitcoin 4 Hour Chart
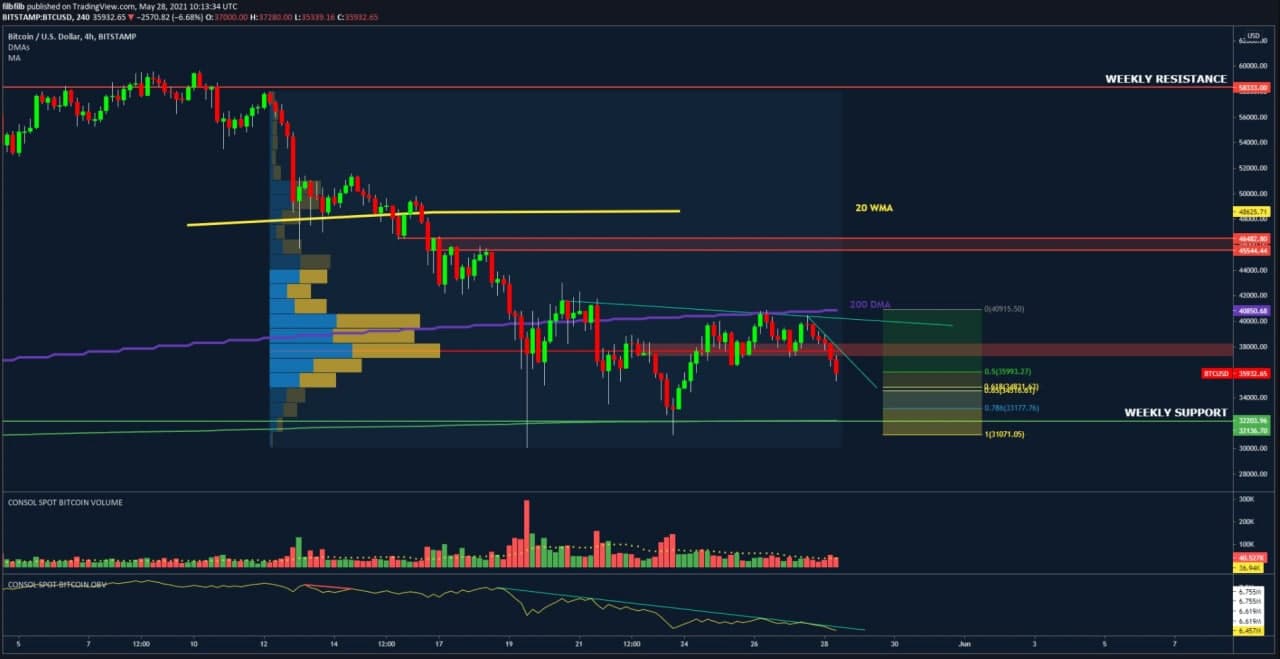
Bitcoin sold off early on Friday having been rejected by the 200 DMA and horizontal resistance. The Point of control (POC) of the selloff to $30k has been lost meaning $37.5k level needs to be reclaimed relatively quickly to avoid a retest of weekly support. The 61.8% retracement at $34.5k needs to hold as support on lower timeframes.
If bitcoin is able to break $40k, previous support / resistance at $45.5-46.5k can expected to be resistance, with the 20 WMA potentially being front run.
Consolidated On Balance Volume (OBV) and volume both show a lack of Spot trading interest; in particular the 4 hour OBV trending down. A break of this downtrend would be promising, but at present highlights bears being in control.
https://www.tradingview.com/x/On802QGD/
Figure 2: 4 Hour Bitcoin Chart.
Bitcoin Derivatives and Market Depth
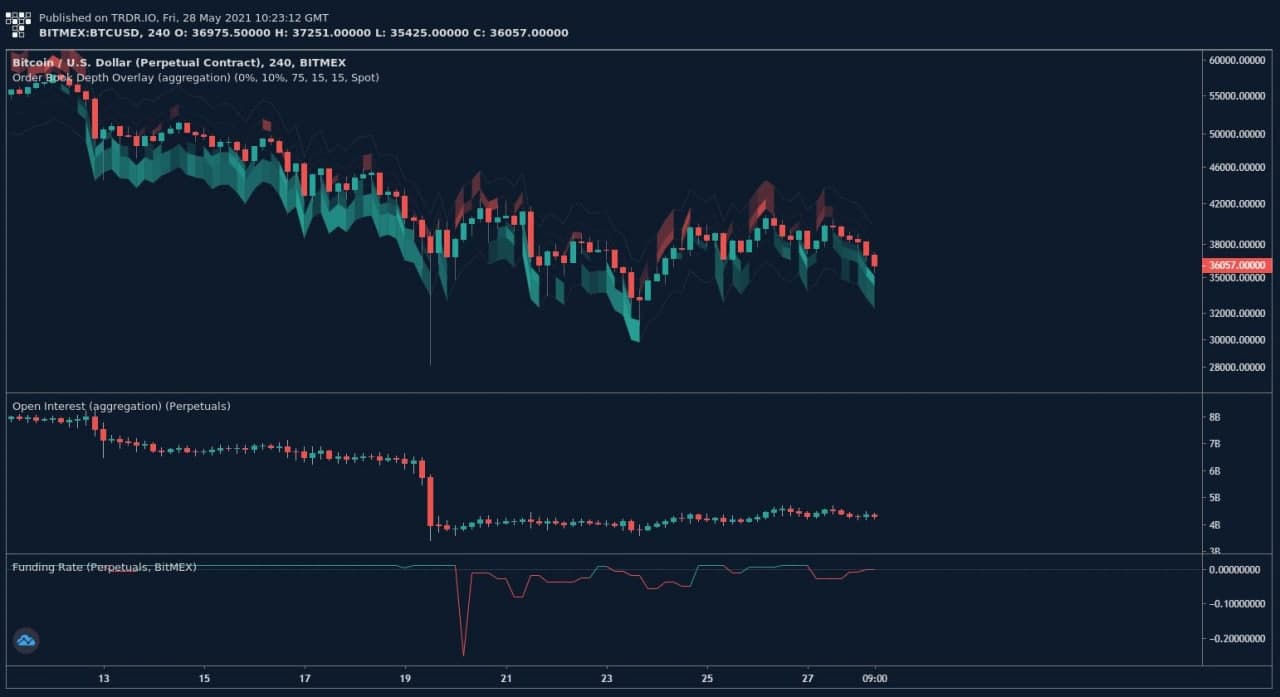
Looking at the bid-ask depth, prices between $30 – 35k favour the bid; most selling has been done at the market with market participants looking to exit after an onslaught of negative news, which has seen participants exiting at a loss as seen on the SOPR live chart.
Open interest has failed to recover with leverage participants being largely wiped out in the sell off and not re-entering. Funding has also remained low / negative which further echo’s the market.
https://trdr.io/snapshot/834A6FDD9662C827.png
Figure 3: TRDR Platform showing Market Depth https://trdr.io/a/decentrader
Ethereum Weekly Chart
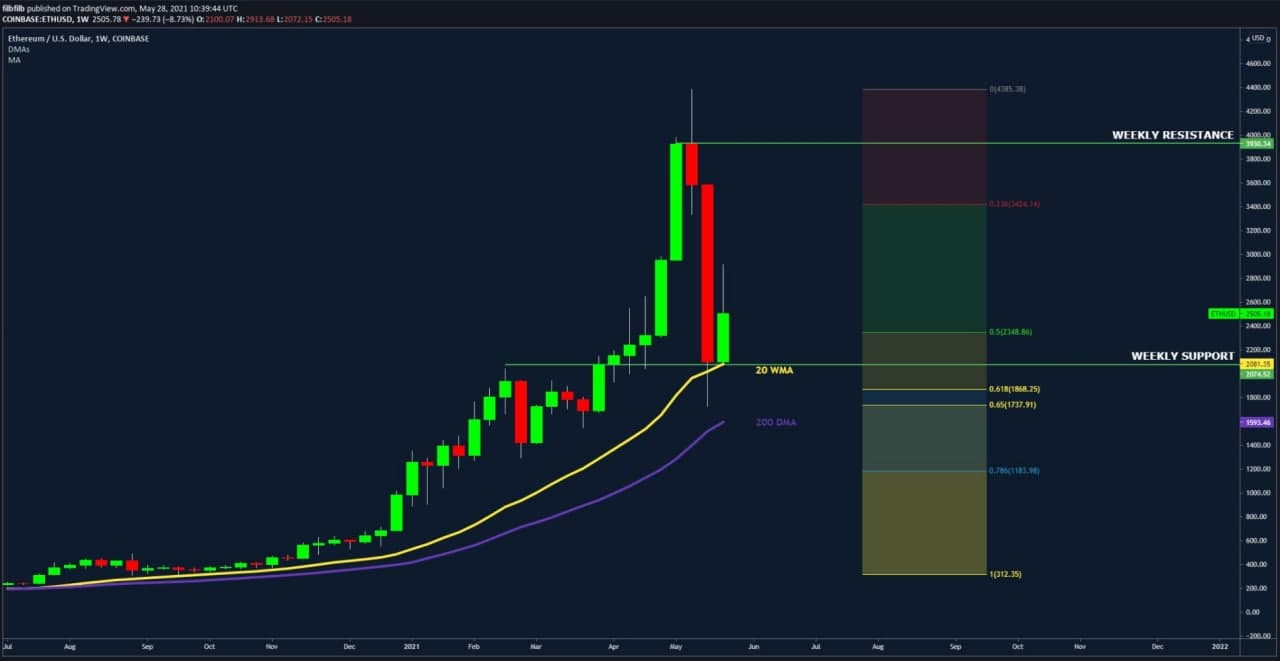
Ethereum similarly sold off back to the 61.8% retracement, but unlike Bitcoin bounced above the 20WMA, but like Bitcoin was also rejected around a critical pivot price; $3k for ETH.
https://www.tradingview.com/x/N563Sry5/
Figure 4: Ethereum Weekly Chart
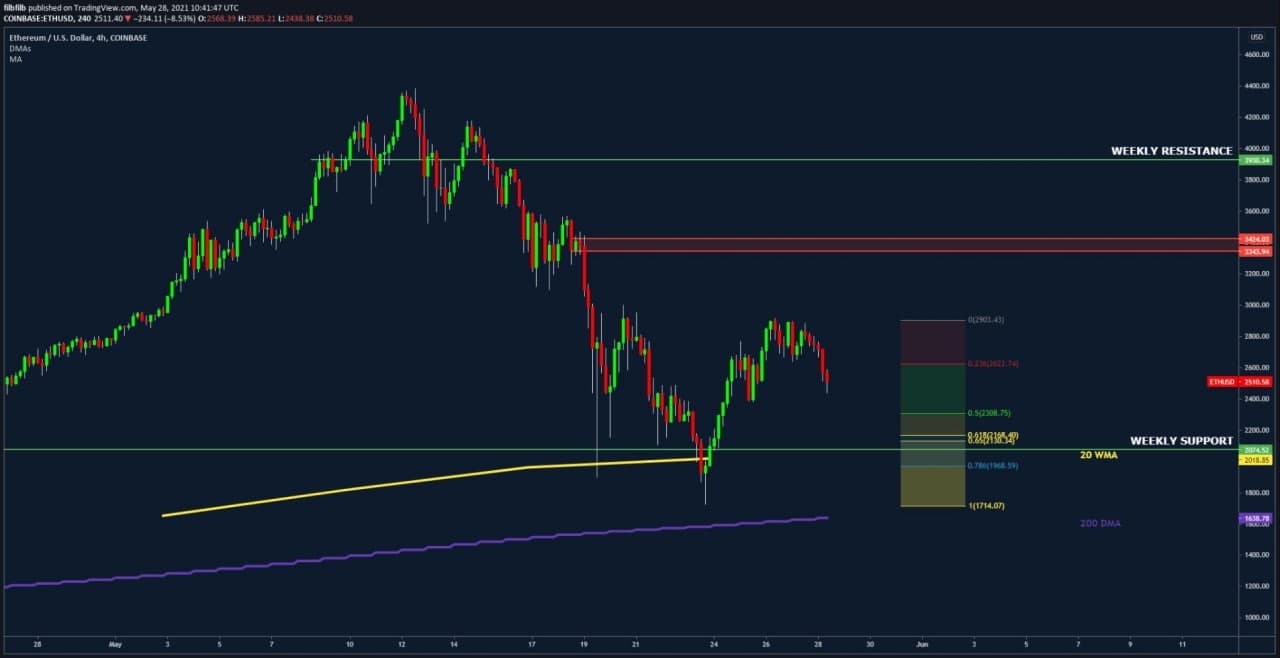
Ethereum 4 Hour Chart
On lower timeframes, ETH Price action is very similar to Bitcoin, but ETH has stayed notably higher than its lows than Bitcoin. If a low can be found around $2300 and break the $3k level, $3500 – $3300 would likely be retested, however as we have seen, it will be largely dependent upon the strength of Bitcoin. Similarly to late, we expect ETH to outperform to the upside and at least match any bearish movement to Bitcoin.
https://www.tradingview.com/x/EvsahxdB/
Figure 5: Ethereum 4 Hour Chart
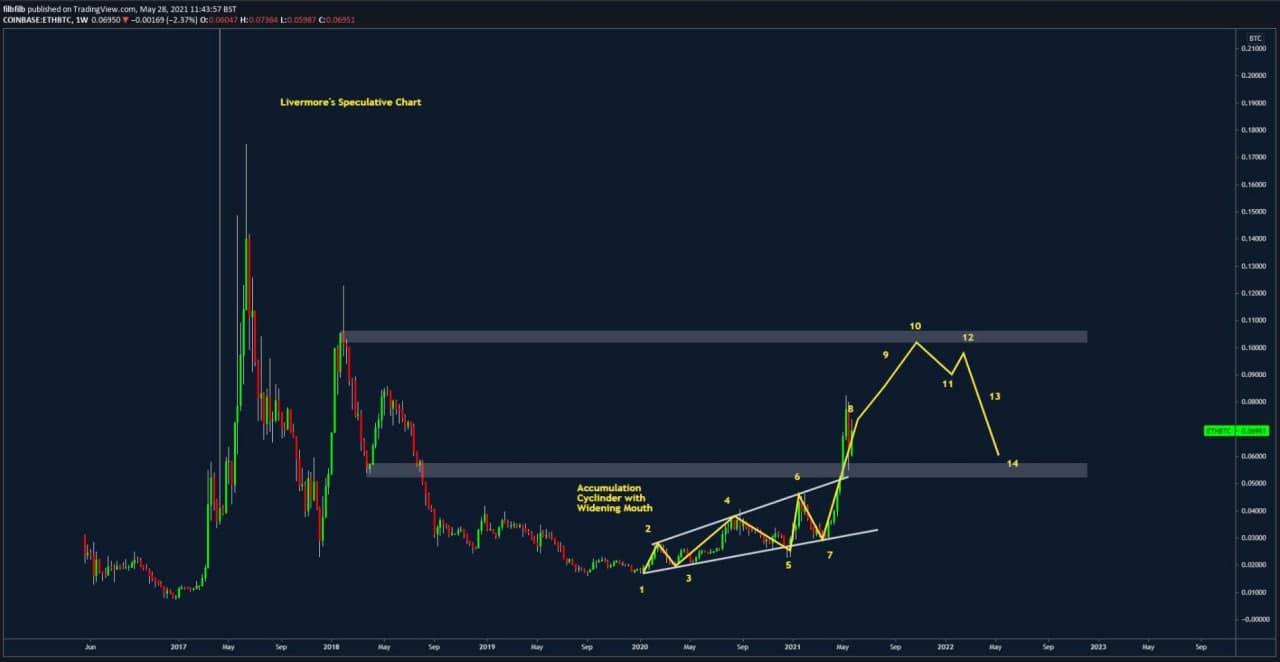
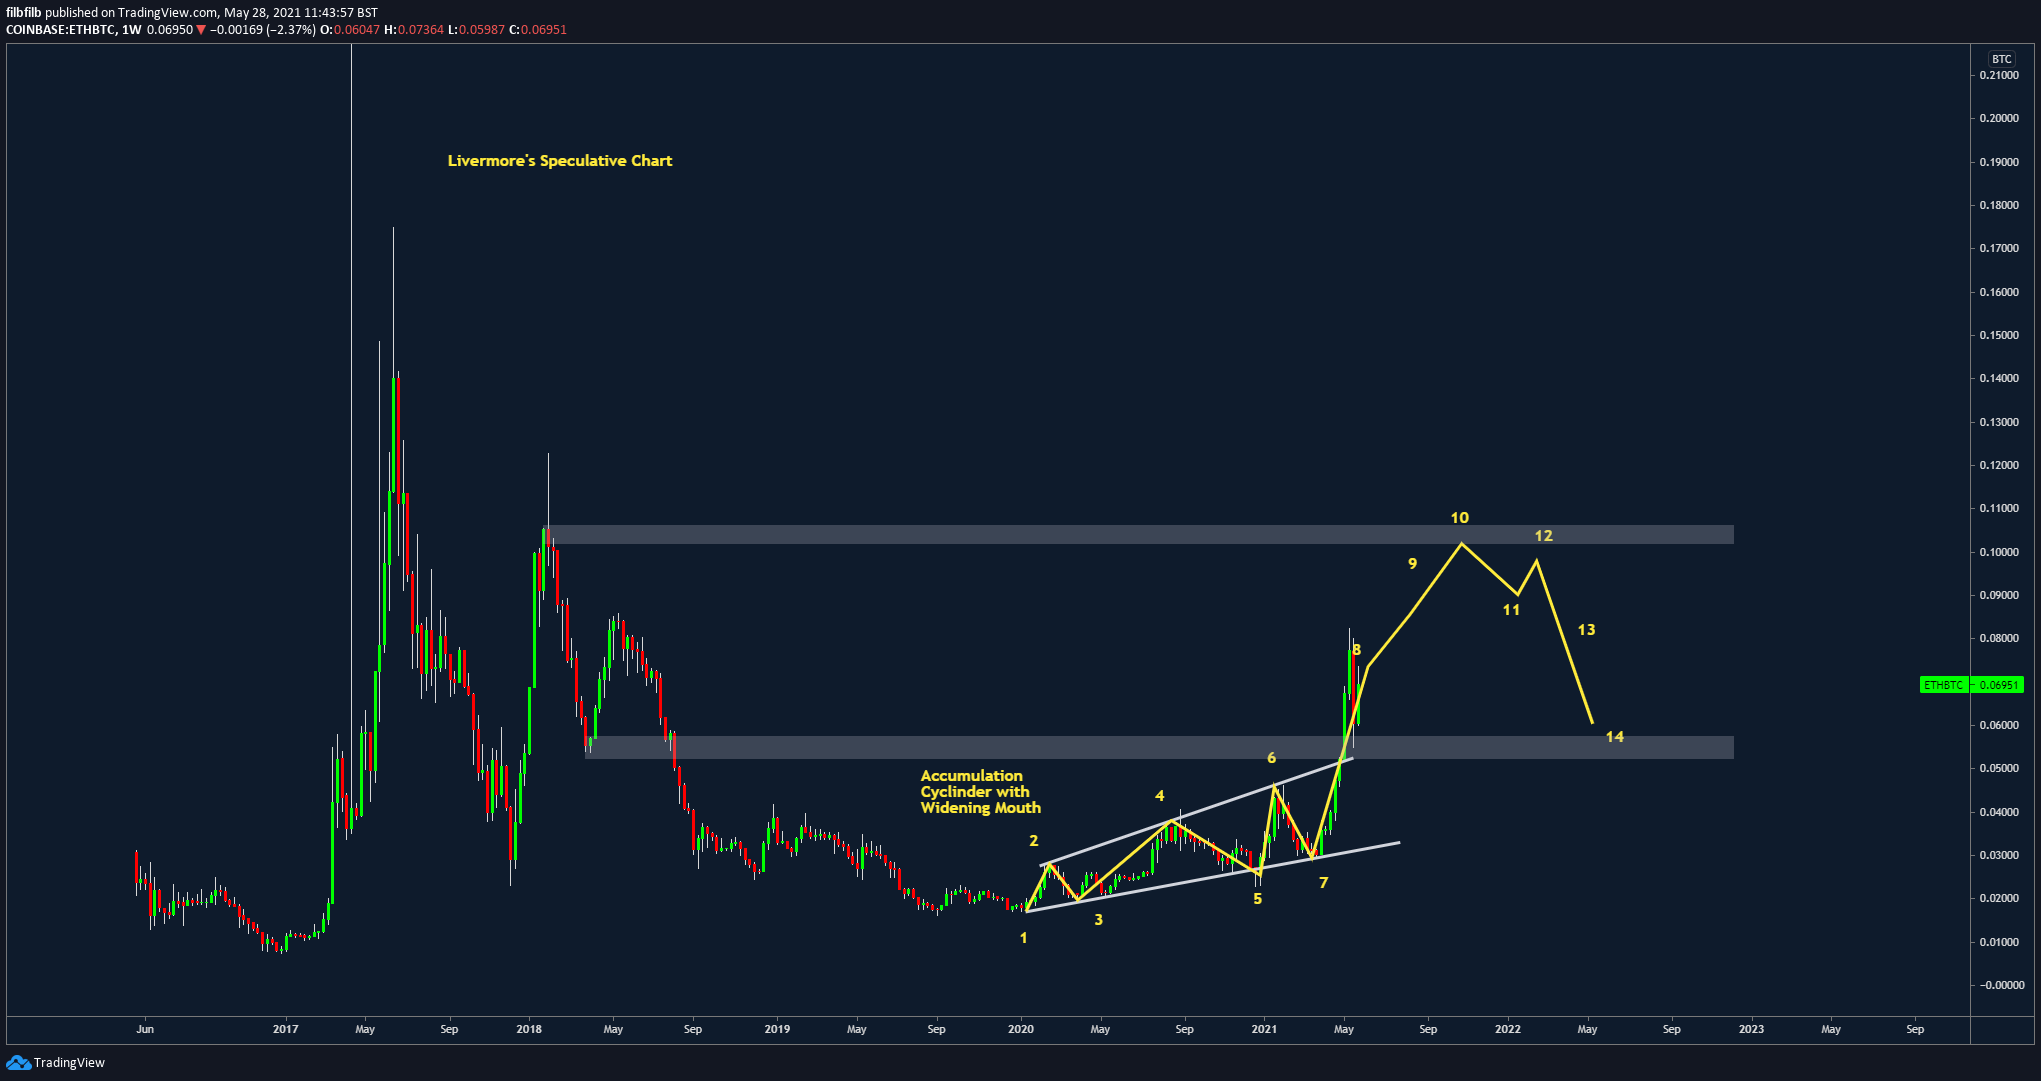
Ethereum / Bitcoin Weekly Chart
ETH/BTC has been following the Livermore Accumulation schematic and saw a correction back to previous resistance which has since turned into support at 0.055 BTC.
Should Bitcoin consolidate and hold the $30k lows, we are expecting ETH to continue to complete the schematic as we move towards the EIP 1559 implementation which may see increased focus and positive narrative around reduced energy requirement with the switch to proof of stake which could see Ethereum take share from Bitcoin.
https://s3.tradingview.com/snapshots/5/5vSC2TuU.png
Figure 6: Ethereum / Bitcoin Livemore’s Speculative Chart 4 Hour Chart
For now, eyes are on Bitcoin to see if the lows can be held going into the weekend, with particular attention being around the 200 DMA which is currently the line in the sand for the bulls.
filbfilb.
Want to learn more? Click here to subscribe!
Disclaimer: Nothing within this article should be misconstrued as financial advice. The financial techniques described herein are for educational purposes only. Any financial positions you take on the market are at your own risk and own reward. If you need financial advice or further advice in general, it is recommended that you identify a relevantly qualified individual in your Jurisdiction who can advise you accordingly.


