Bitcoin Market Update – Ranging but Macro Bullish
Hi everyone, here is a Bitcoin update where I outline my current Bitcoin perspective looking at both technical analysis and also on-chain data.
For higher time frame traders and investors, it has been a sleepy week or so for Bitcoin. Price continues to range within a symmetrical triangle. Ultimately, we are consolidating between the levels of $10.2k and $11k.
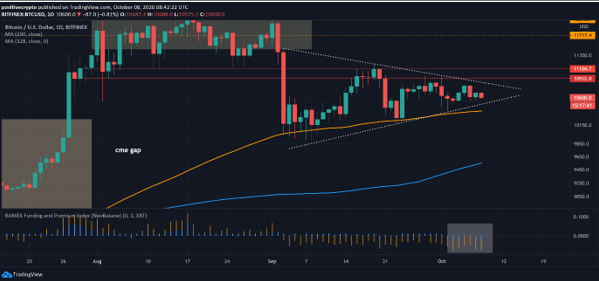
Figure 1: Bitcoin technical analysis
What I have been watching and talking about in Decentrader livestreams is how well Bitcoin held up against the 128 day moving average (orange line) in recent weeks. Price tapping the 128DMA in the previous bull market was a great buy the dip opportunity. It has worked well so far over the past few weeks, but I would be more cautious if price approached it a third time. If we were not to get a strong reaction off it, I would be concerned that price may spike down to the 200DMA which would also be strong support and would fill the CME gap.
What may work in our favour against that scenario playing out is that derivative traders are already going short, which we can see by the negative funding (shorts are paying longs) highlighted by the shaded box on the chart. This is bullish in my view given that we are above $10k and traders are not over leveraged to the long side. It also sets up potential for a short squeeze to the upside should these shorts be caught offside.
On chain data continues to be bullish
I am spoilt for choice at the moment in terms of live charts that demonstrate we are in the early stages of a bull cycle. So while we may see some relative small moves on low time frames as the market prepares itself for Bitcoin’s next big move, macro indicators continue to show that this is a great time to enter the market on large timeframes.
An interesting chart I came across yesterday was this one showing the extent to which Bitcoin funds have continued to leave exchanges this year:
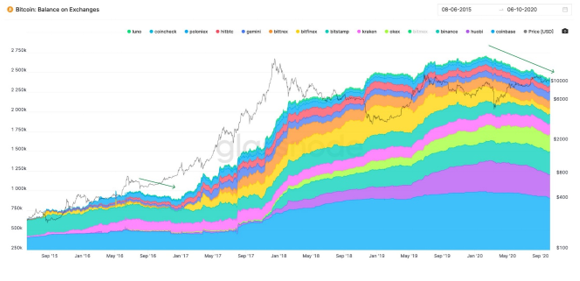
Figure 2: Bitcoin leaving exchanges is a bullish sign
I believe there are likely 3 reasons for this:
- March Covid crash where Bitmex nearly went down. That spooked a lot of traders and made them move their funds off exchanges into cold storage.
- DeFi craze. That took bitcoins off centralised exchanges and onto decentralised exchanges (DEX’s) like Uniswap (and transferred into other tokens at least in the short term). Even though that craze is now slowing there does not seem to be a fast transfer of funds back onto centralised exchanges. It is likely that at least some of those funds have made their way back into bitcoin and into cold storage.
- People are buying up bitcoin and moving it into cold storage as awareness of the coming bull cycle grows.
All of these reasons ultimately mean that a good proportion of bitcoin that was held on exchanges has now made its way into cold storage which makes it less likely to be sold in the short term. This reduces short term supply at a time where we know there is increasing demand from large institutions like Microstrategy and hedge funds.
On the above chart, we can see what happened to price when this situation also occurred in Sept 2016. It helped kick start the previous bull cycle.
This is all playing out while we see the amount of Bitcoin that hasn’t moved in over a year still at all time highs. The 1-year HODL chart below shows that 63% of all Bitcoin has now not moved on-chain for a year. Again, we saw a similar situation early in the previous bull cycle.
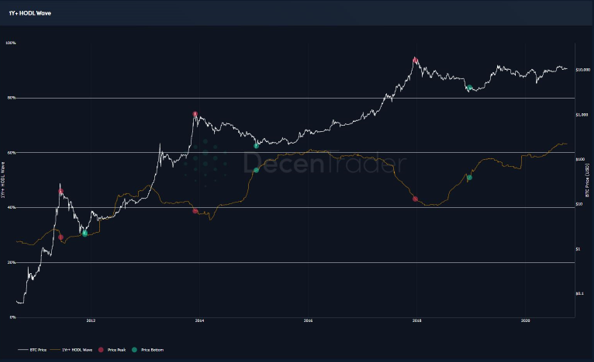
Figure 3: The amount of Bitcoin that has not moved for over a year is at all time highs of 63%.
Looking at the Bitcoin Investor Tool, we can see that price is comfortably above the 2yr Moving Average which historically signals the best time to accumulate Bitcoin.
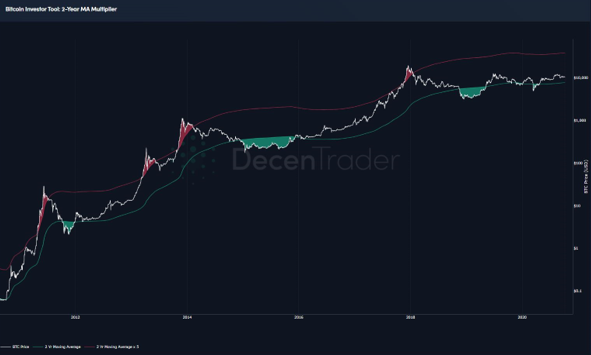
Figure 4: Bitcoin Investor Tool: Price is comfortably above the 2yr MA (green line).
In March we had our major liquidity event with the covid crash, which I believe provided the last time to see price under the 2yr MA this cycle. I think we will likely breach the upper red line before we go back down to retest the green line. The upper red line (2yr MA x 5) is currently at $40,000 and will trend up as price tries to catch up with it. My current estimate is that price will likely reach it when we are around $80,000. Historically we have seen price then go parabolic once it breaches that upper red boundary, so 2021 is shaping up to be very interesting indeed for Bitcoin!
Cheers,
Philip Swift
Disclaimer: Nothing within this article should be misconstrued as financial advice. The financial techniques described herein are for educational purposes only. Any financial positions you take on the market are at your own risk and own reward. If you need financial advice or further advice in general, it is recommended that you identify a relevantly qualified individual in your Jurisdiction who can advise you accordingly.


