Bitcoin to Rally After Taproot Upgrade?
Many people do not realise it, but Bitcoin is about to have its first major upgrade in years. In the next couple of days, the Bitcoin Taproot upgrade will be rolled out.
When this happens a new address type will be created that will allow for different (and in some cases new) transaction types, ranging from simple to complex, to look similar. Without getting into too much detail, this is important from a fungability perspective which is important over the long term for Bitcoin to build a medium of exchange narrative.
TL:DR If that all sounds a bit heavy, the topline summary of the Taproot upgrade is that it is actually made up of three Bitcoin Improvement Protocols (BIP’s) which in combination will allow for:
1) greater levels of privacy
2) cheaper transaction costs (especially for more complex transactions)
3) Lightning Network usage benefits
4) improved smart contract functionality
While all four benefits are arguably very important, improved smart contract functionality could really help accelerate innovation within the Bitcoin ecosystem over the coming years, in ways that right now cannot even be imagined.
The last time Bitcoin had such a major upgrade was the Segwit upgrade in Aug 2017. At that time the price of Bitcoin was at $4000, it then went on to rally up to nearly $20,000 in the following four months. Will we see a similar rally this time around? Given how bullish many macro indicators are looking right now, and the rush of new money entering crypto, it is certainly possible.
So let’s dig in.
Late-longing leverage traders get flushed out…again!
On 10 Nov, after reaching a new all-time high of $69,000, Bitcoin then crashed down to $63,000 within the space of just four hours. As we have seen so many times in Bitcoin’s history and discussed in previous market updates, it was a case of retail traders using leverage, coming in to long the new all-time high breakout, only to find themselves get shaken out and liquidated.
The tell-tale signs were there as leverage trading funding rates jumped up…
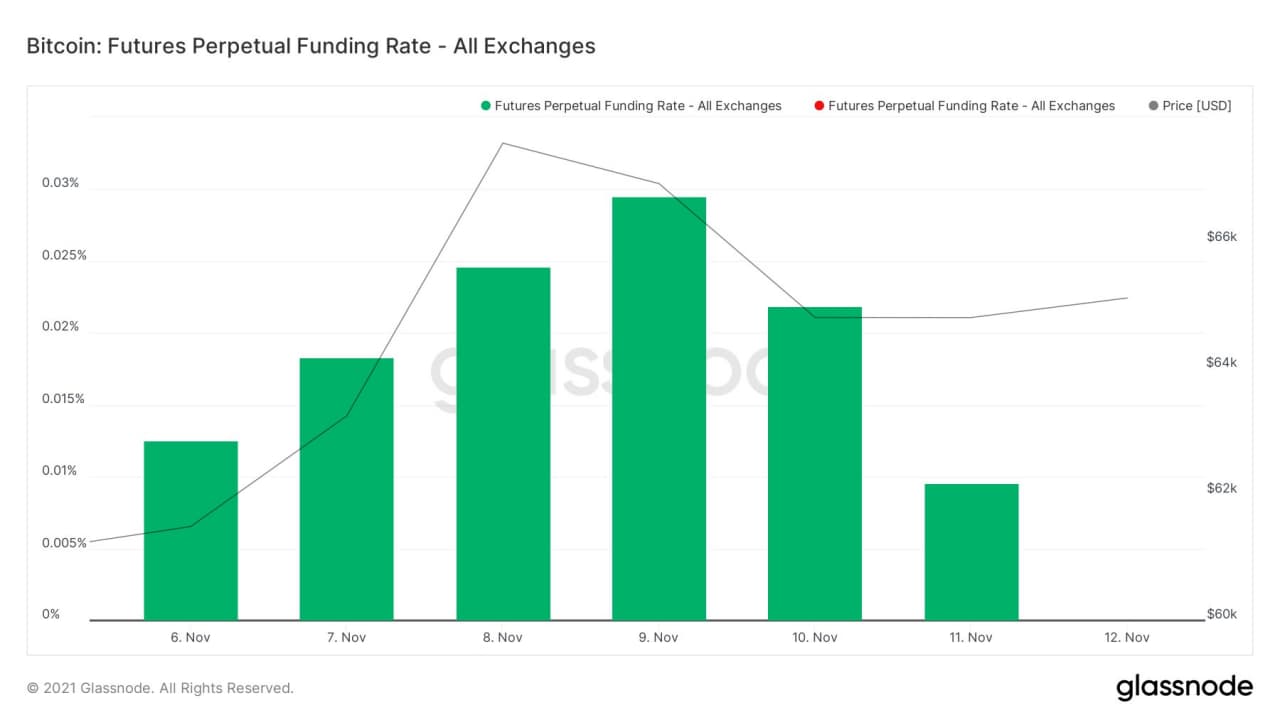
Figure 1: Funding rates across all exchanges continued to rise as price began to drop
…along with Open Interest (OI) also massively jumping up and then remaining high as price began to drop.
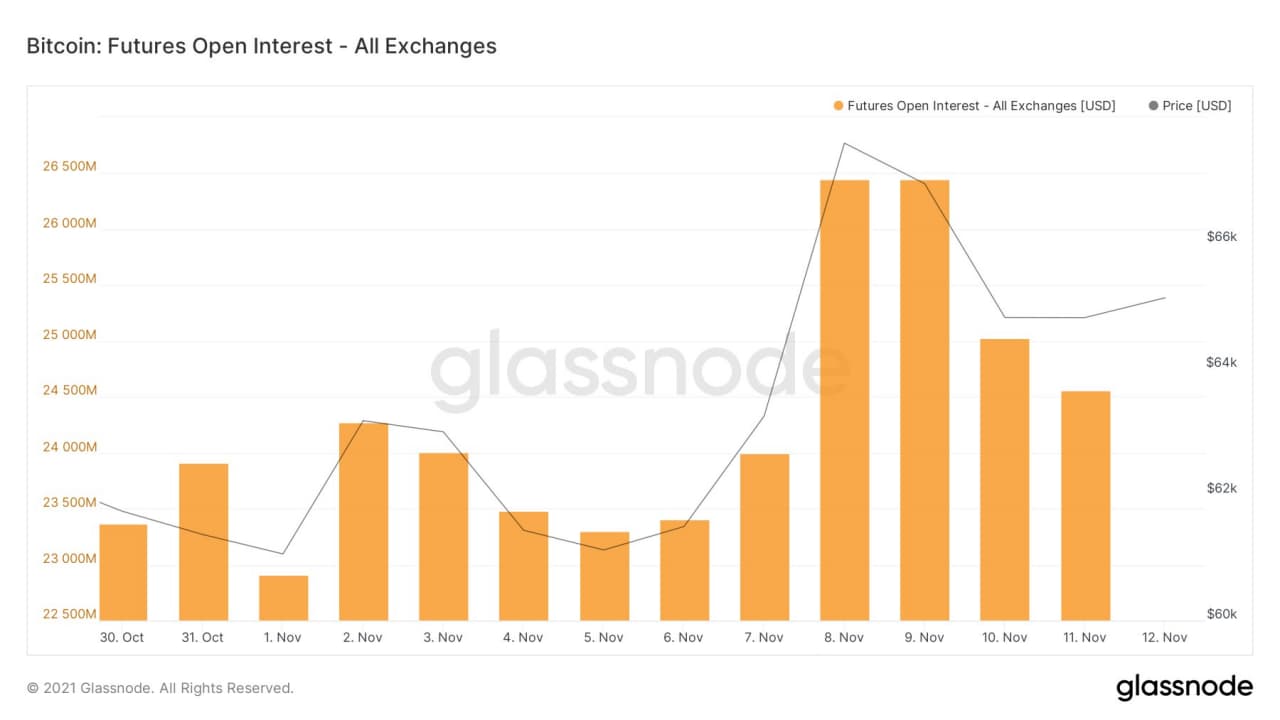
Figure 2: Open Interest remained high as price dropped.
Many of these leveraged late-longers were then trapped and forced to exit their positions adding more fuel to the fire as $BTC price quickly corrected down to $63,000.
What’s the Situation Now?
At the time of writing, funding and open interest levels are looking healthier and more stable. Token-margined funding rates, in particular, have returned to neutral which is an encouraging sign as it signals that leverage traders are no longer so bullish that they are prepared to directly leverage-up on their crypto-assets.
The Predator indicator is showing a mixed picture, which is not surprising given the violent, choppy nature of price action over the past week.
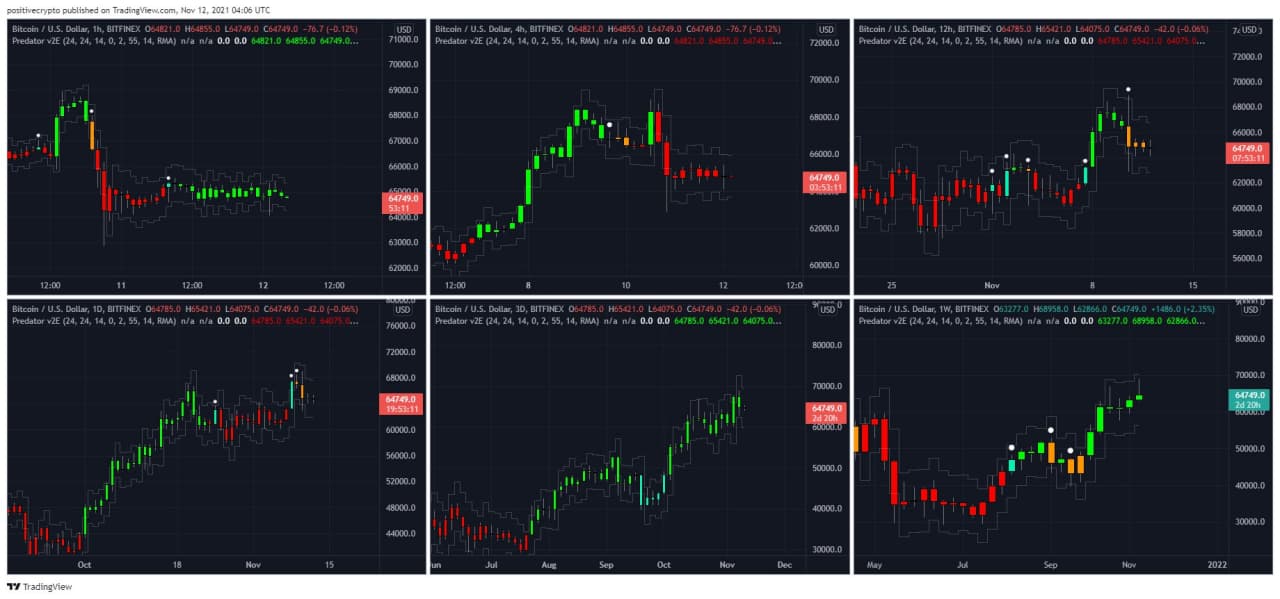
Figure 3: Predator turning bullish on the hourly and remains bullish on higher timeframes
Because of the recent sharp pullback, the 4hr, 12hr, and 1D timeframes remain red (bearish).
However, we are seeing buying volume come back in, which is making the 1hr timeframe bullish again. Should that continue then we can expect the 4hr, 12hr and 1D to follow suit going into the weekend.
For now, the 3D and 1W remain green (bullish). So the longer-term bullish trend on Predator remains intact for now.
Get access to Predator HERE.
The recent pullback has taken price back to the previous all-time-high level of $64,700. It has also driven price BELOW the Moonraker mean reversion line, which currently sits at $66,000.
The nearest Moonraker support level lies at $61,900 which could be hit over the weekend to drive out any remaining excess leverage before trending up higher. Given the amount of leverage+OI is not especially high right now though, we are not overly expectant on this scenario playing out versus a gradual grind up – but it is still important to note from a risk management perspective.
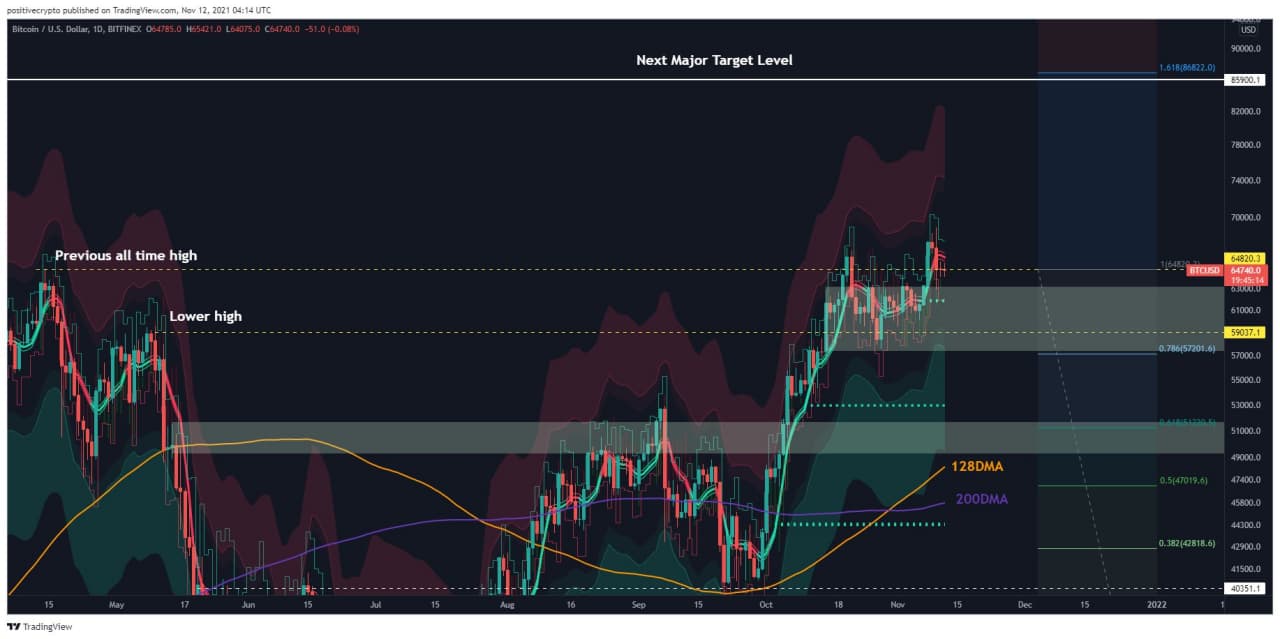
Figure 4: Price currently below the Moonraker mean reversion
LEARN ABOUT THE BENEFITS OF THE MOONRAKER TRADING TOOL HERE.
We remain bullish on high time frames and continue to expect price to rally up to the $85,000 – $90,000 region in the coming weeks, which aligns with the 1.618 fib retracement level.
Active Address Sentiment Indicator Reset
One of many encouraging signs on-chain is the growth of active addresses relative to price change. This is shown on the Active Address Sentiment indicator which is very effective in identifying broad periods where Bitcoin is over or undervalued.
When the orange line (price change) is under the active addresses band, $BTC is undervalued and presents a good time to buy. When it is above the active address band $BTC may be rallying into overbought territory.
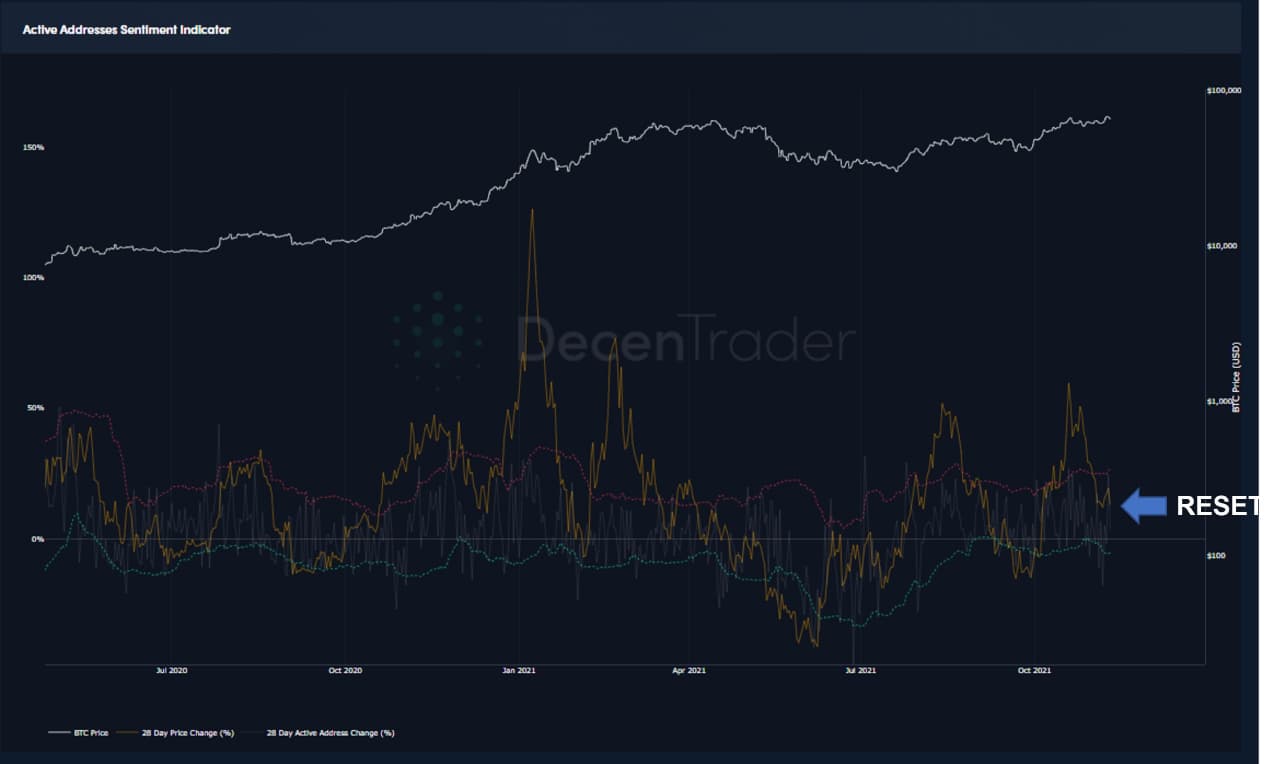
Figure 5: Active Address Sentiment Indicator
Right now the indicator has reset back into the bands. This represents a healthy retrace which may well be a precursor for a bullish run-up out of the bands, similar to the one we saw at the start of the year.
Entering the Next Cycle Phase?
When we compare this cycle from the most recent halving date to previous cycles, we can see that so far we have not experienced a final parabolic run-up.
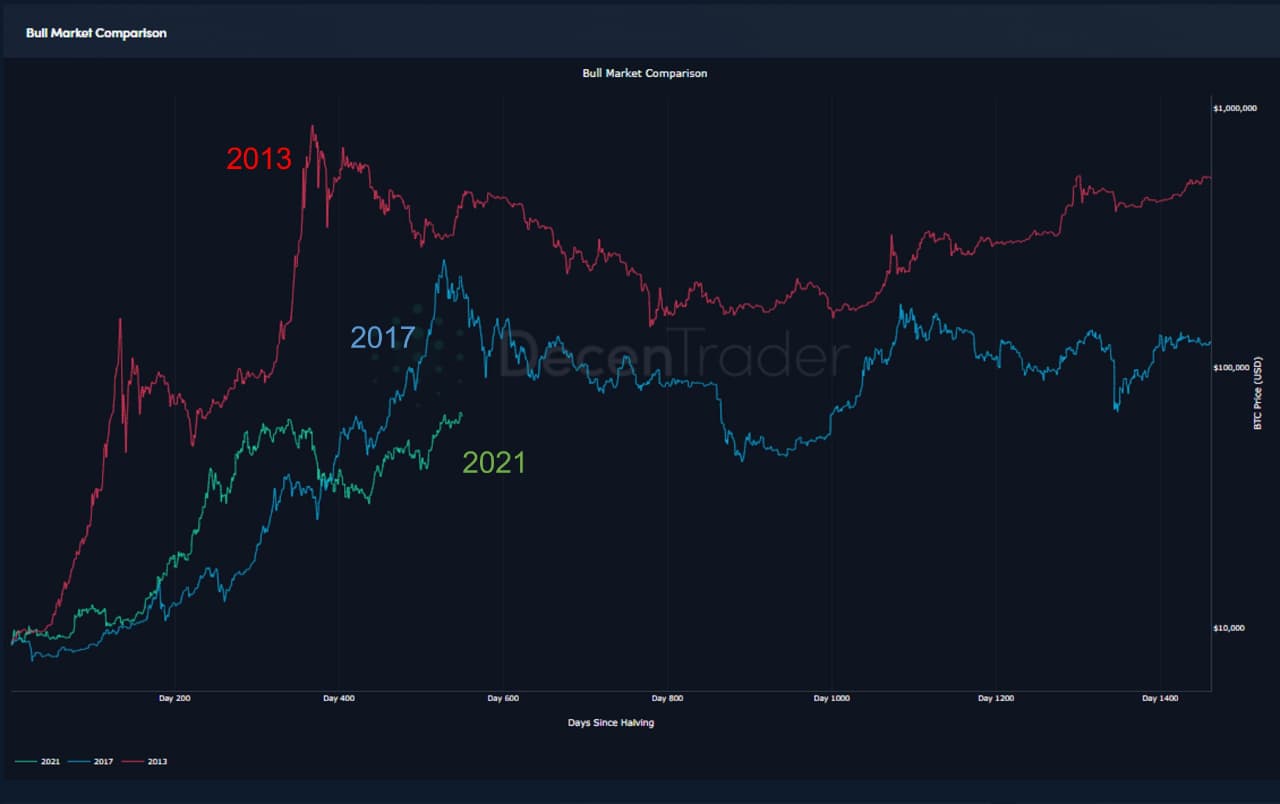
Figure 6: Bitcoin bull markets overlaid
When we overlay the cycles like this, we can see how the current cycle is not directly like either of the previous cycles but is in fact a combination of the two. With a more muted potential double-top playing out compared to 2013, and less consistency than 2017.
As we attempt to break out of the previous all-time high from May this year, it is setting up the prospect of a potential parabolic run-up as we saw in the late stages of the previous bull runs. As can be seen on the chart above, the characteristics of these late market phases are consistent up days with very few pullback opportunities. This allows few opportunities for people who exit early to get back in.
Perfect Conditions for the Commando Indicator
Such a market environment is ideal for the Commando market scanner tool. A broadly bullish environment for Bitcoin can result in fantastic opportunities for altcoins if you know where to look.
The new Commando algorithmic market scanner is able to identify the key opportunities for over 100 crypto assets (including Bitcoin and Ethereum) every four hours.
We are already starting to see some potential near-term trade opportunities as we go into the weekend…
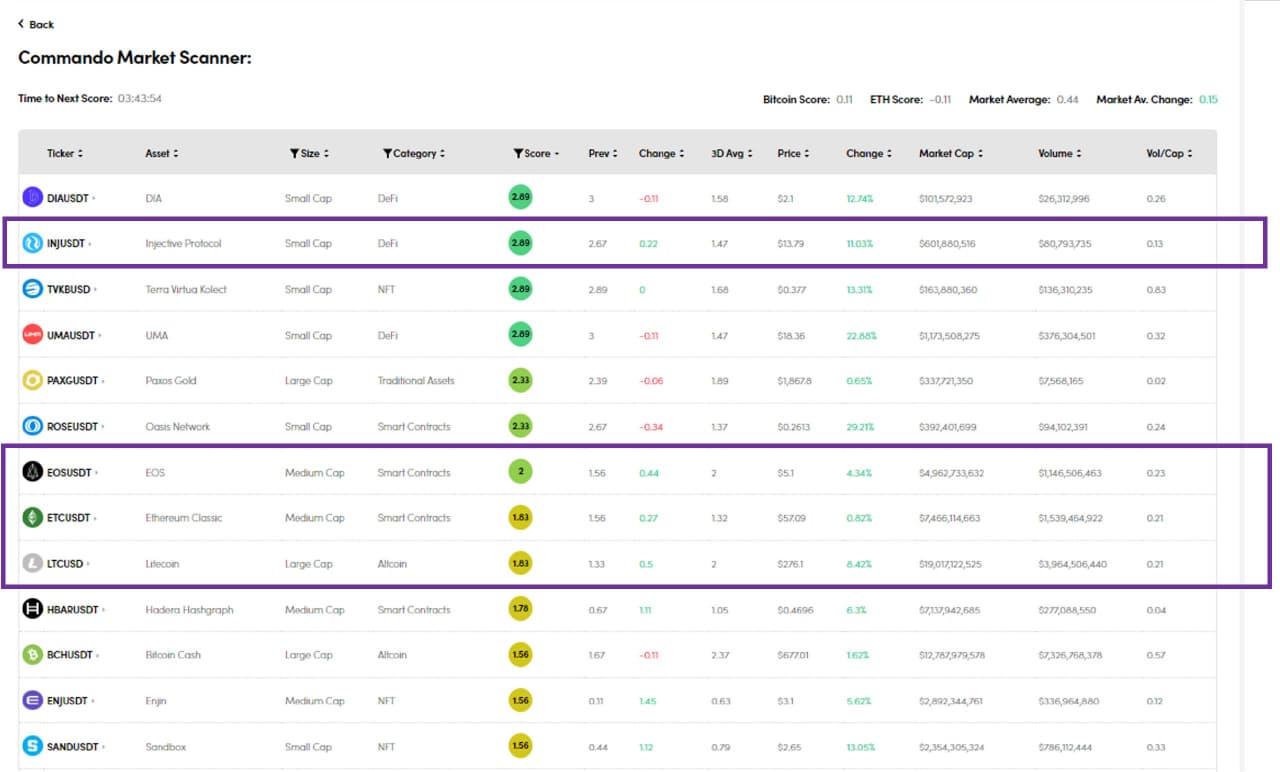
Figure 7: $INJ, $EOS, $ETC, $LTC all look promising going into the weekend
INJUSD is painting a high Commando score and a positive change score which are favorable conditions for potential near-term trading to the long-side.
It is also notable that several old-cycle coins are looking increasingly bullish. We may well be entering a phase of the market now where the old-cycle coins appear good value after being overlooked for so long.
$EOS, $ETC, $LTC are all posting strong scores on Commando with positive change scores also. These are ones to watch this Friday heading into the weekend and may present good long trade opportunities.
Click here to learn more about Commando and access the algorithmic market scanner.
Have a nice weekend everyone,speak soon!
Disclaimer: Nothing within this article should be misconstrued as financial advice. The financial techniques described herein are for educational purposes only. Any financial positions you take on the market are at your own risk and own reward. If you need financial advice or further advice in general, it is recommended that you identify a relevantly qualified individual in your Jurisdiction who can advise you accordingly.


