Bitcoin – Make or break?
For the past week, Bitcoin price action has kept traders guessing, as it chops around in a range between $45,800 to $51,300 with funding rates that are broadly flat.
For now, price is being held up at several key levels. The first is the 0.5 fib retracement of the April previous all-time high to summer-crash lows. In addition to that, the price is currently resting above the 200DMA and also the important 1yr MA.
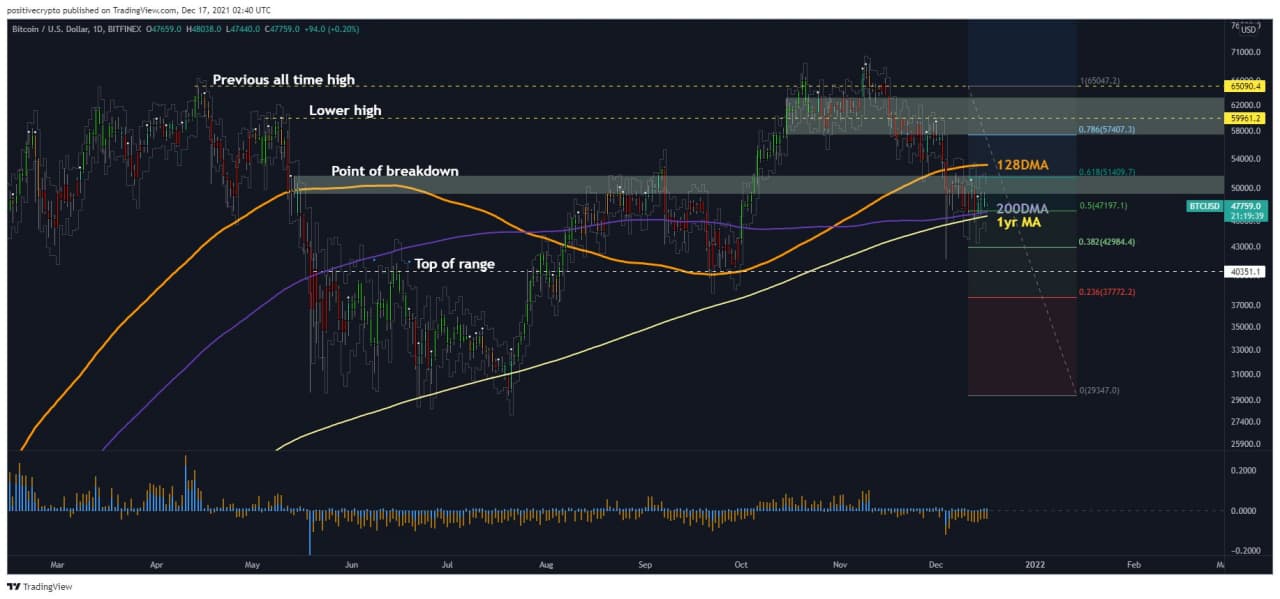
Figure 1: Price ranging above key moving averages this past week.
Bears are waiting in anticipation of another potential move down to the top of the range of the summer lows at $40,300. Such a move would also sweep the low of the crash earlier this month.
The 1yr MA has historically been a very important axis point for Bitcoin in determining whether the macro trend is bullish or bearish. The price tested it twice in the summer during the crash and is now testing it again. Losing it with several daily closes below it would be bearish and could indicate an acceleration of a trend to the downside.
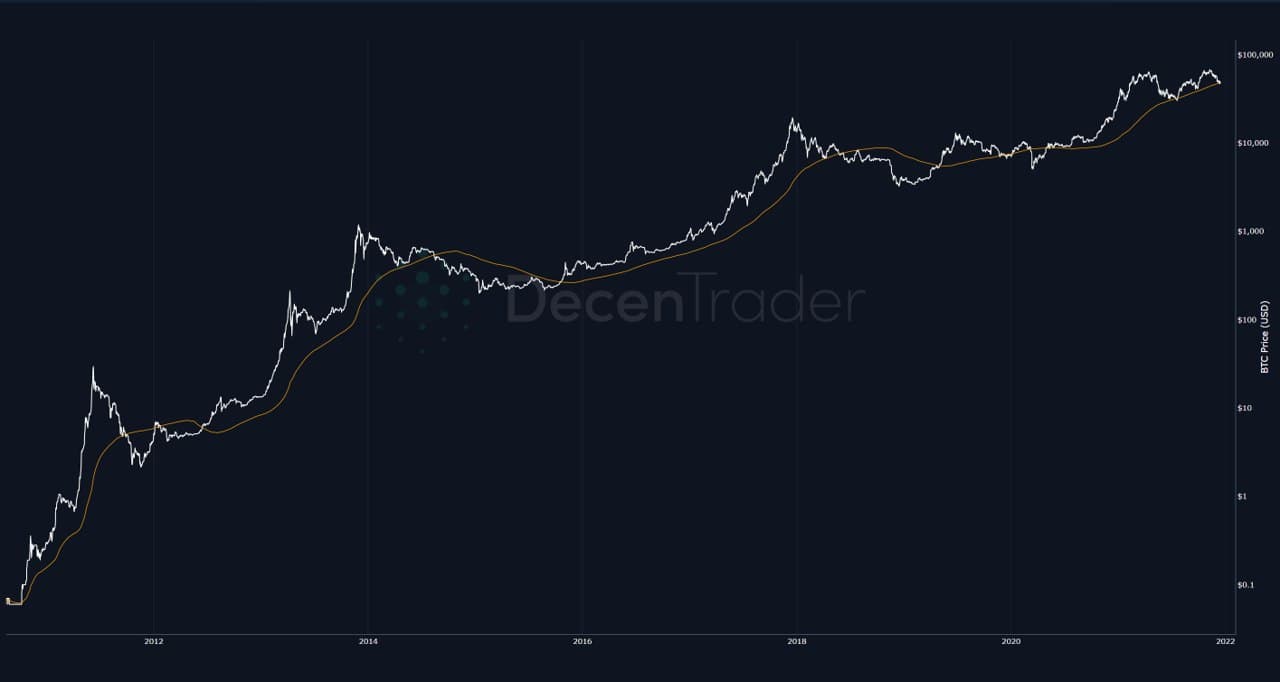
Figure 2: The 1yr MA (orange line) historically indicates a bearish downward trend continuation when price drops below it.
Moonraker Support and Resistance
At the time of writing, the price is sitting just below the Moonraker mean reversion line. There are clear lines in the sand in terms of Moonraker support and resistance.
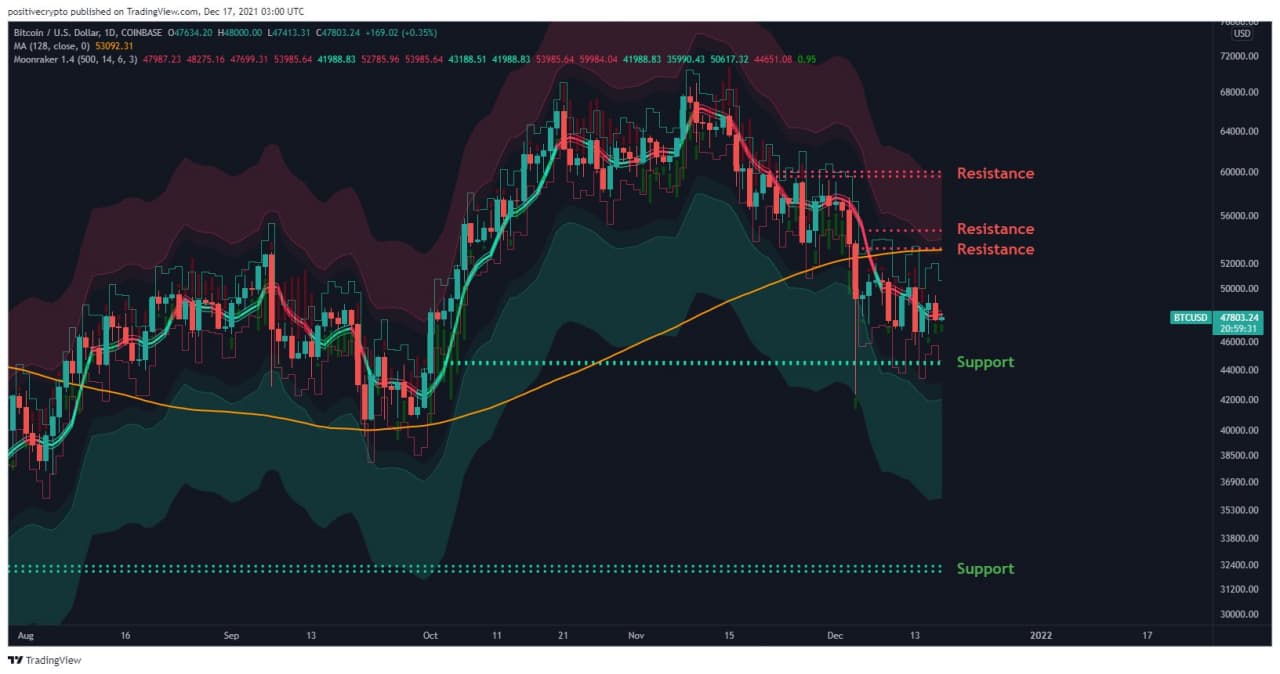
Figure 3: Moonraker support and resistance levels.
First support level is sitting at $44,600, which could provide a fakeout below the current range to hunt stops. Beyond that, the next major Moonraker support sits at $32,300.
The first major resistance level aligns exactly with the 128DMA (orange line) so we expect that to be a key level of interest and action for traders should price reach it. Should price break and close above that level then we would expect many currently bearish traders to flip their bias bullish again.
Higher up resistance levels for risk management sit at $54,750 and $59,600.
YOU CAN ACCESS MOONRAKER HERE.
Predator indicates caution on higher timeframes
The cross-timeframe Predator outlook remains mixed as there is little sign of significant volume in the market currently.
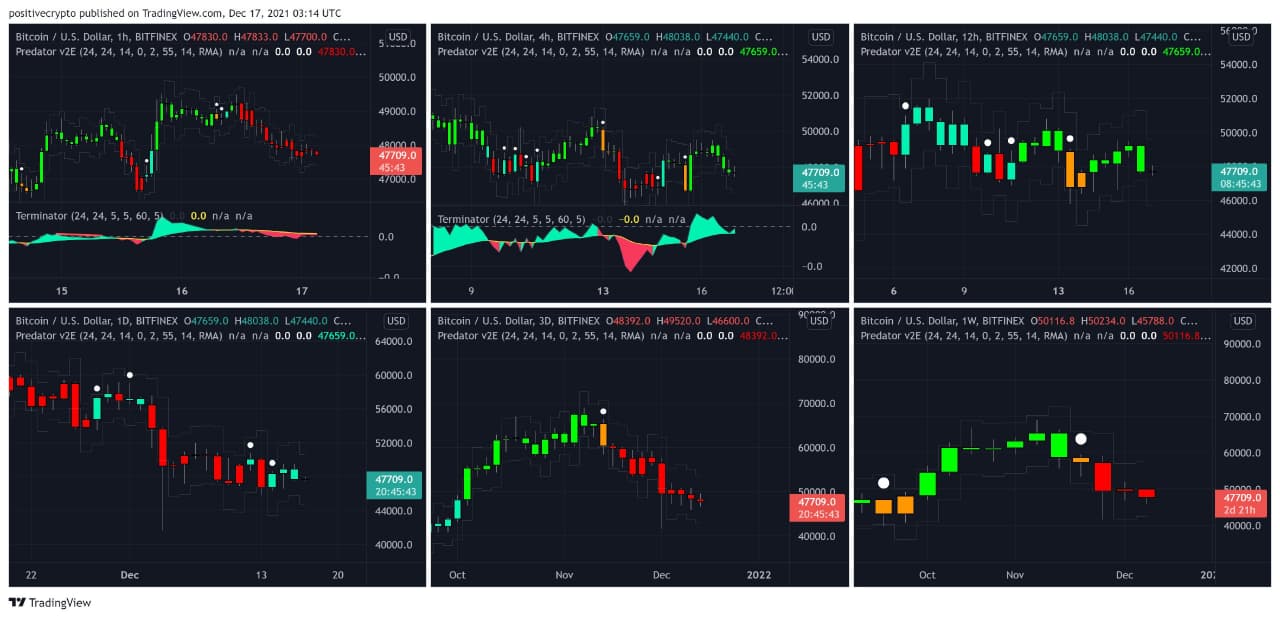
Figure 4: Predator highlights the lack of clear trend direction right now.
The 1hr chart shows lackluster volumes both on Terminator and Predator as the price is currently trailing off within a range. Despite the 4hr, 12hr, and 1D being bullish, the higher time frames of the 3D and 1W continue to signal that we remain in a bearish downtrend until we see evidence of more meaningful buying volume step in.
The 3-day Predator timeframe is extremely useful for high time frame trend identification, and we can observe how it successfully indicated that the uptrend had become exhausted in early November before we experienced the crash. Once again demonstrating its usefulness as a trading risk management tool.
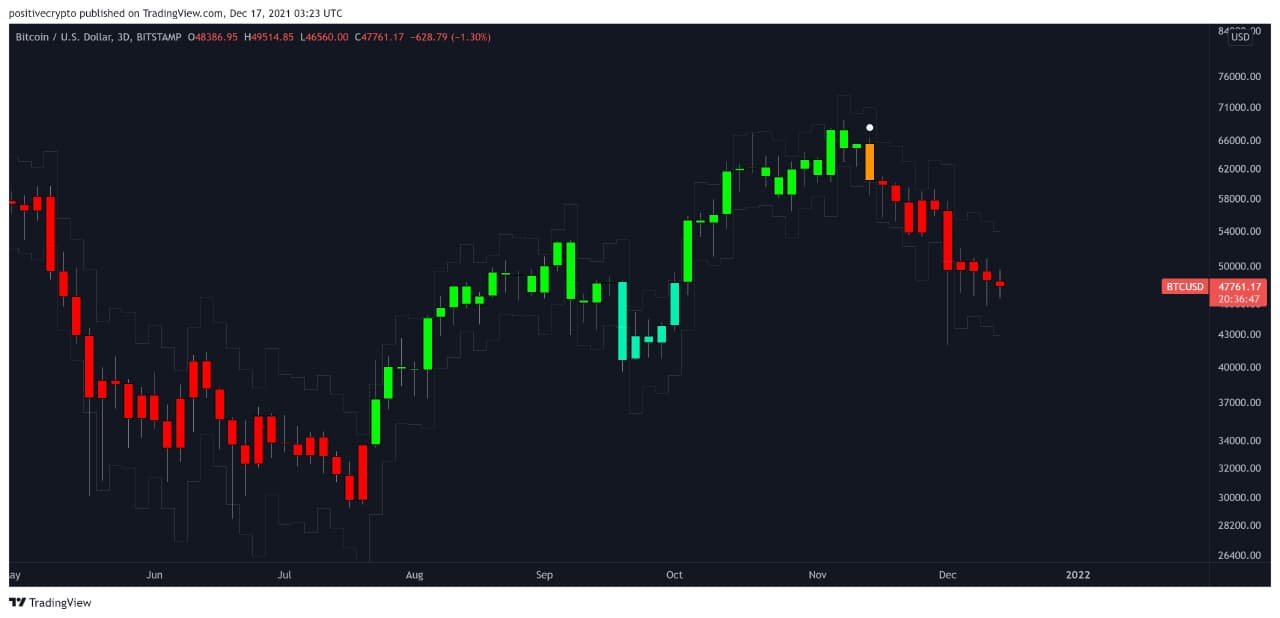
Figure 5: Predator 3-day timeframe.
Onchain remains bullish
Despite the bearish price action, several on-chain tools are indicating the Bitcoin network remains in a healthy state relative to price.
We continue to see the percentage of bitcoin being HODL’d increase. The 1yr HODL wave chart is now increasing despite the drop in $BTC price over the past 6 weeks. This indicates that the resolve of long-term holders of Bitcoin is not letting up and they continue to hold in anticipation of much higher prices.
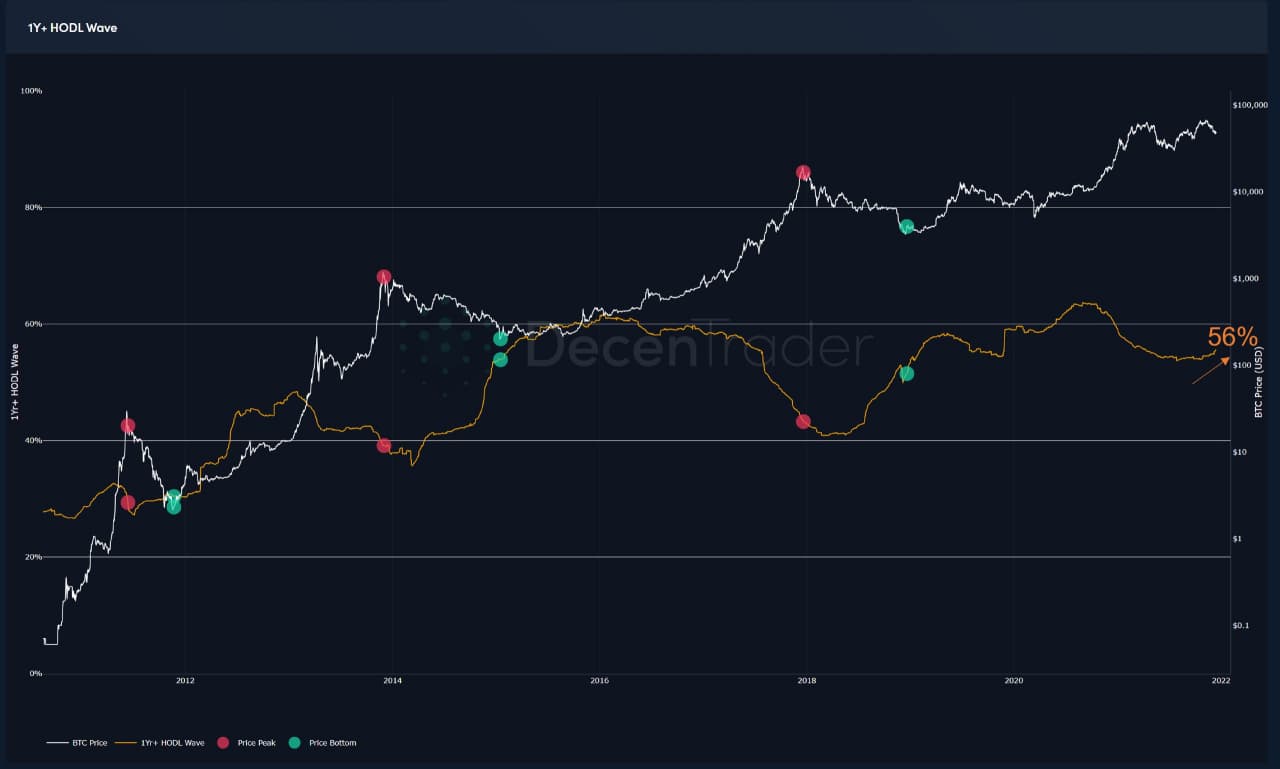
Figure 6: 1yr HODL Wave
DECENTRADER MEMBERS CAN VIEW THE 1yr HODL WAVE LIVE CHART HERE.
In addition to this, on-chain volumes remain strong relative to recent price action suggesting that network activity is also in a very healthy state. Advanced NVT is now at levels so low they have rarely been seen before in Bitcoin’s history. Each time Advanced NVT was this far below the green standard deviation bands, there was a strong bounce in price in the weeks after.
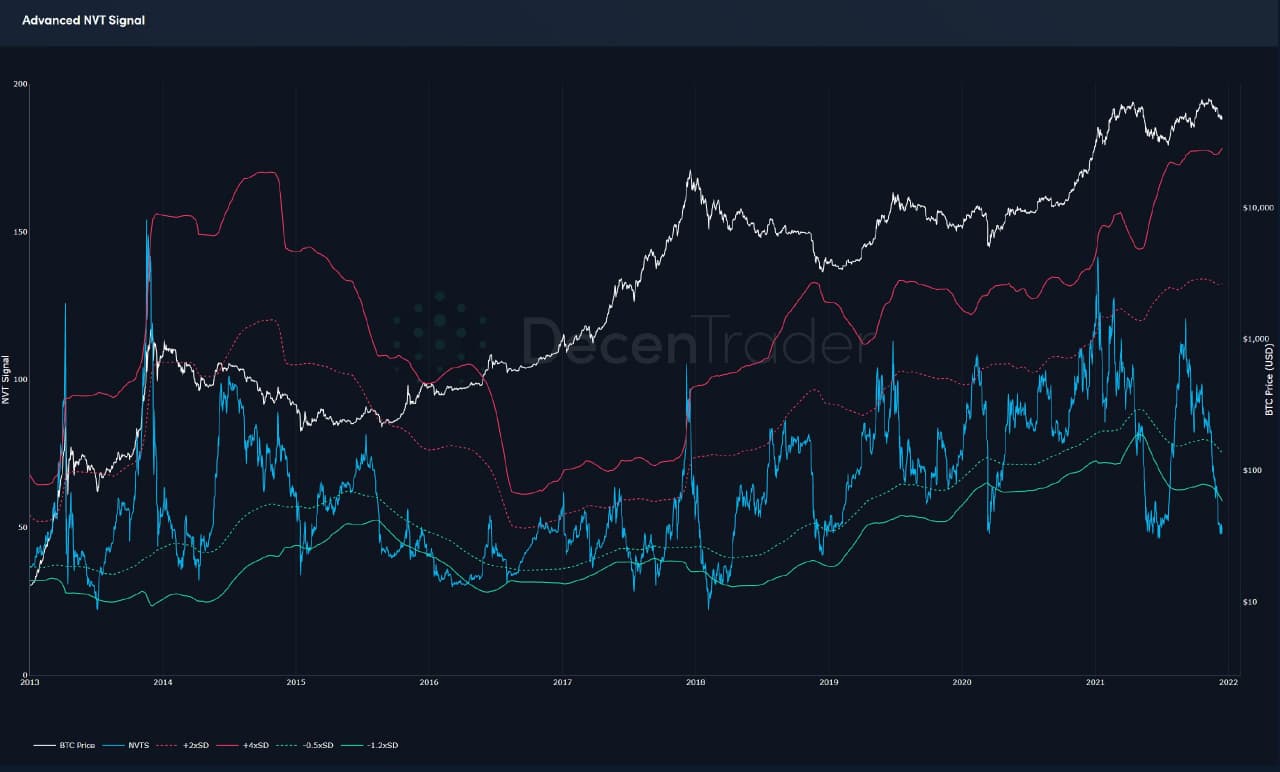
Figure 7: Advanced NVT Signal has rarely been this far below the standard deviation bands.
Will we see the same this time with a bounce and rally into the Christmas break? Or will we see more year-end profit-taking? Right now $BTC is at a key decision point level, so it would certainly be wise to manage one’s risk carefully until a clear trend emerges.
To use some of the tools mentioned in this newsletter and explore many others to help your trading and investing, head over to Decentrader.com
Speak again soon,
The Decentrader Team
Disclaimer: Nothing within this article should be misconstrued as financial advice. The financial techniques described herein are for educational purposes only. Any financial positions you take on the market are at your own risk and own reward. If you need financial advice or further advice in general, it is recommended that you identify a relevantly qualified individual in your Jurisdiction who can advise you accordingly.


