Bitcoin – Looking Stronger!
Our previous Market Update on 28 January was appropriately named ‘Finally, Some Green Shoots of Optimism’. The price of $BTC was at $37,000 when we saw the opportunity for Bitcoin to trend higher.
Price has since rallied up to $43,400 and we believe that there is the possibility of uptrend continuation over the coming weeks, though near-term caution may be required.
Let’s dive in…
Last time we noted how the Fear and Greed Index was in a unique position because the market had remained in a state of extreme fear for an exceptionally long time. The only other times this had happened were at the bottom of the 2018 bear market and the covid crash.
Such extended periods of extreme fear give an indication that general market participants can be caught offside. We saw that play out with the fast move to the upside that $BTC has shown over the past two weeks.
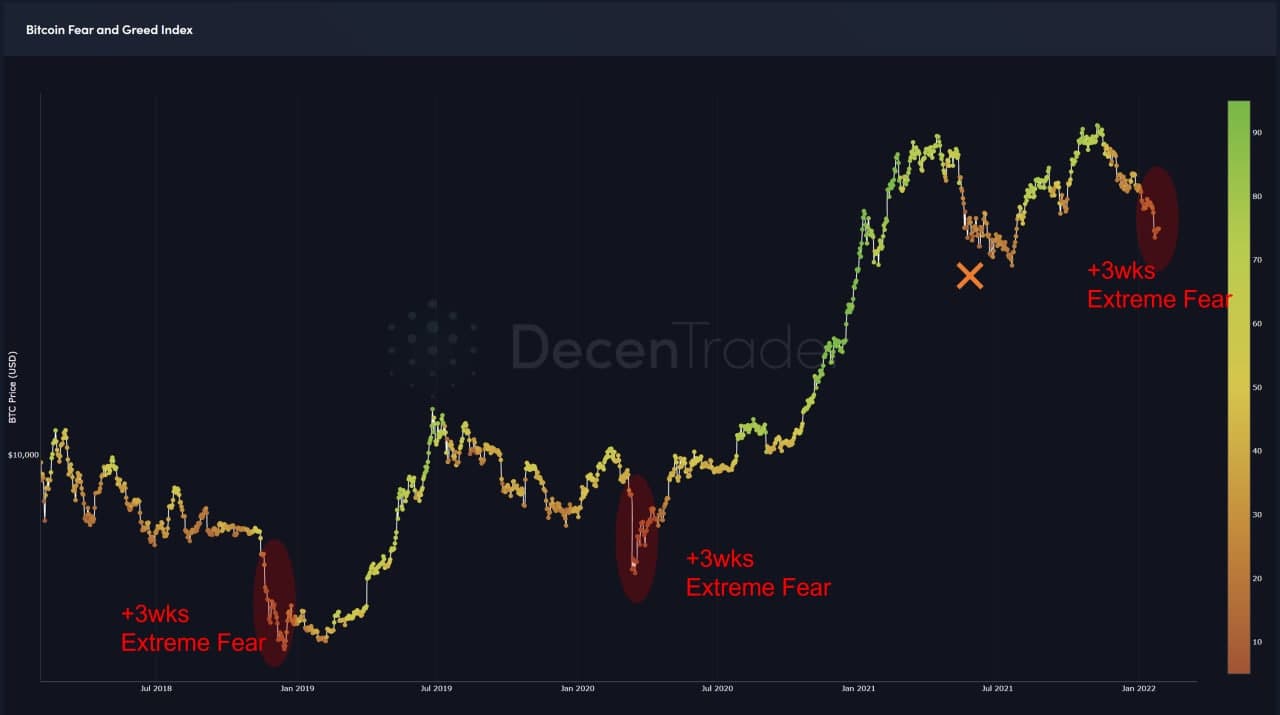
Figure 1: The only times there have been +3 weeks of consistent extreme fear was major lows
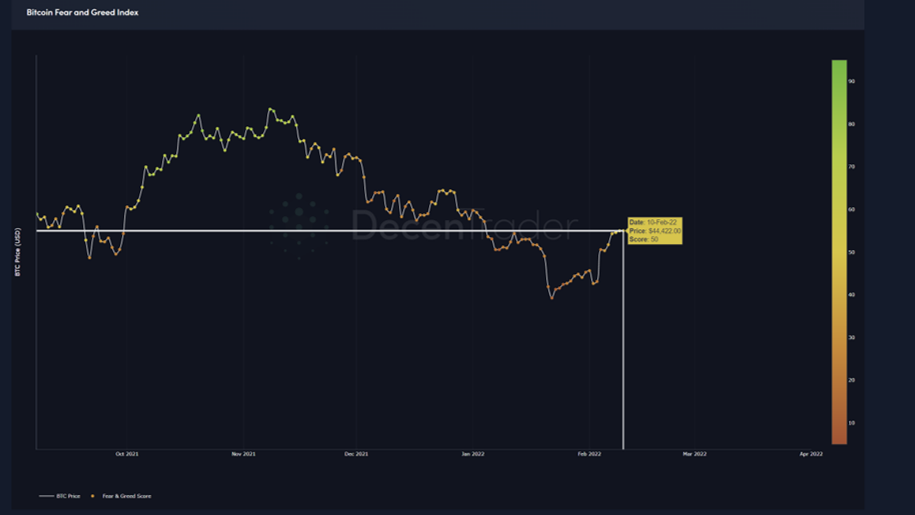
Figure 2: Since then price has rallied and the Fear and Greed score is now 50.
As a result of $BTC price being 20% higher, the Fear and Greed Index score has reset to 50, showing how market sentiment is now significantly more neutral.
Bitcoin Derivatives Oversold
After a good 2-3 months of derivatives traders on the main exchanges stubbornly trying to buy the dip, we finally saw that mindset capitulate, which has created a much healthier looking situation for the bulls in the near term.
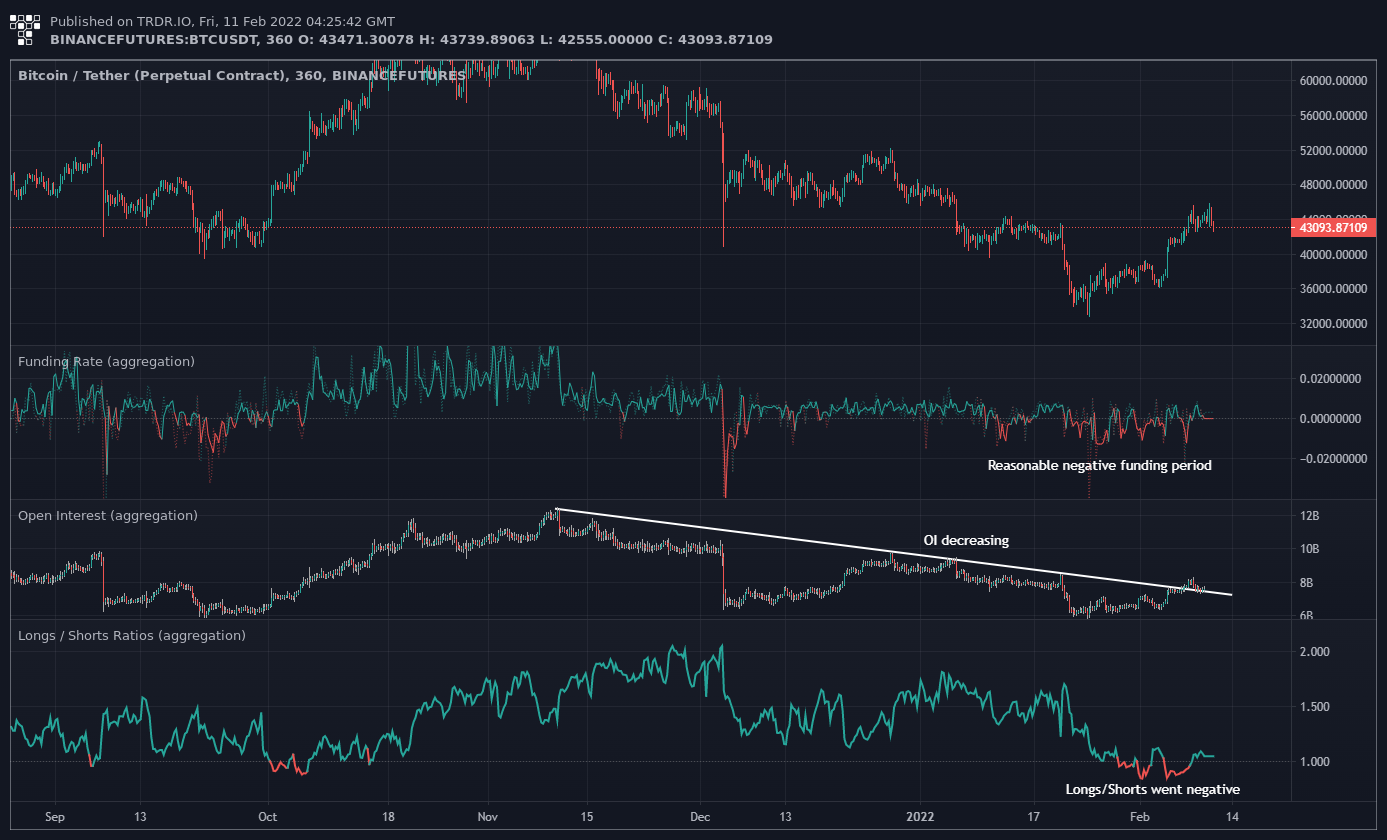
Figure 3: Bitcoin Open Interest, Funding Rate, and Longs/Shorts Ratio.
We have now finally had a sustained period of negative funding rates, seen OI drop over time, and importantly, saw Long/Shorts ratio go negative. Previous times the Longs/Shorts Ratio went negative were around major lows in price before price ultimately rallied thereafter:
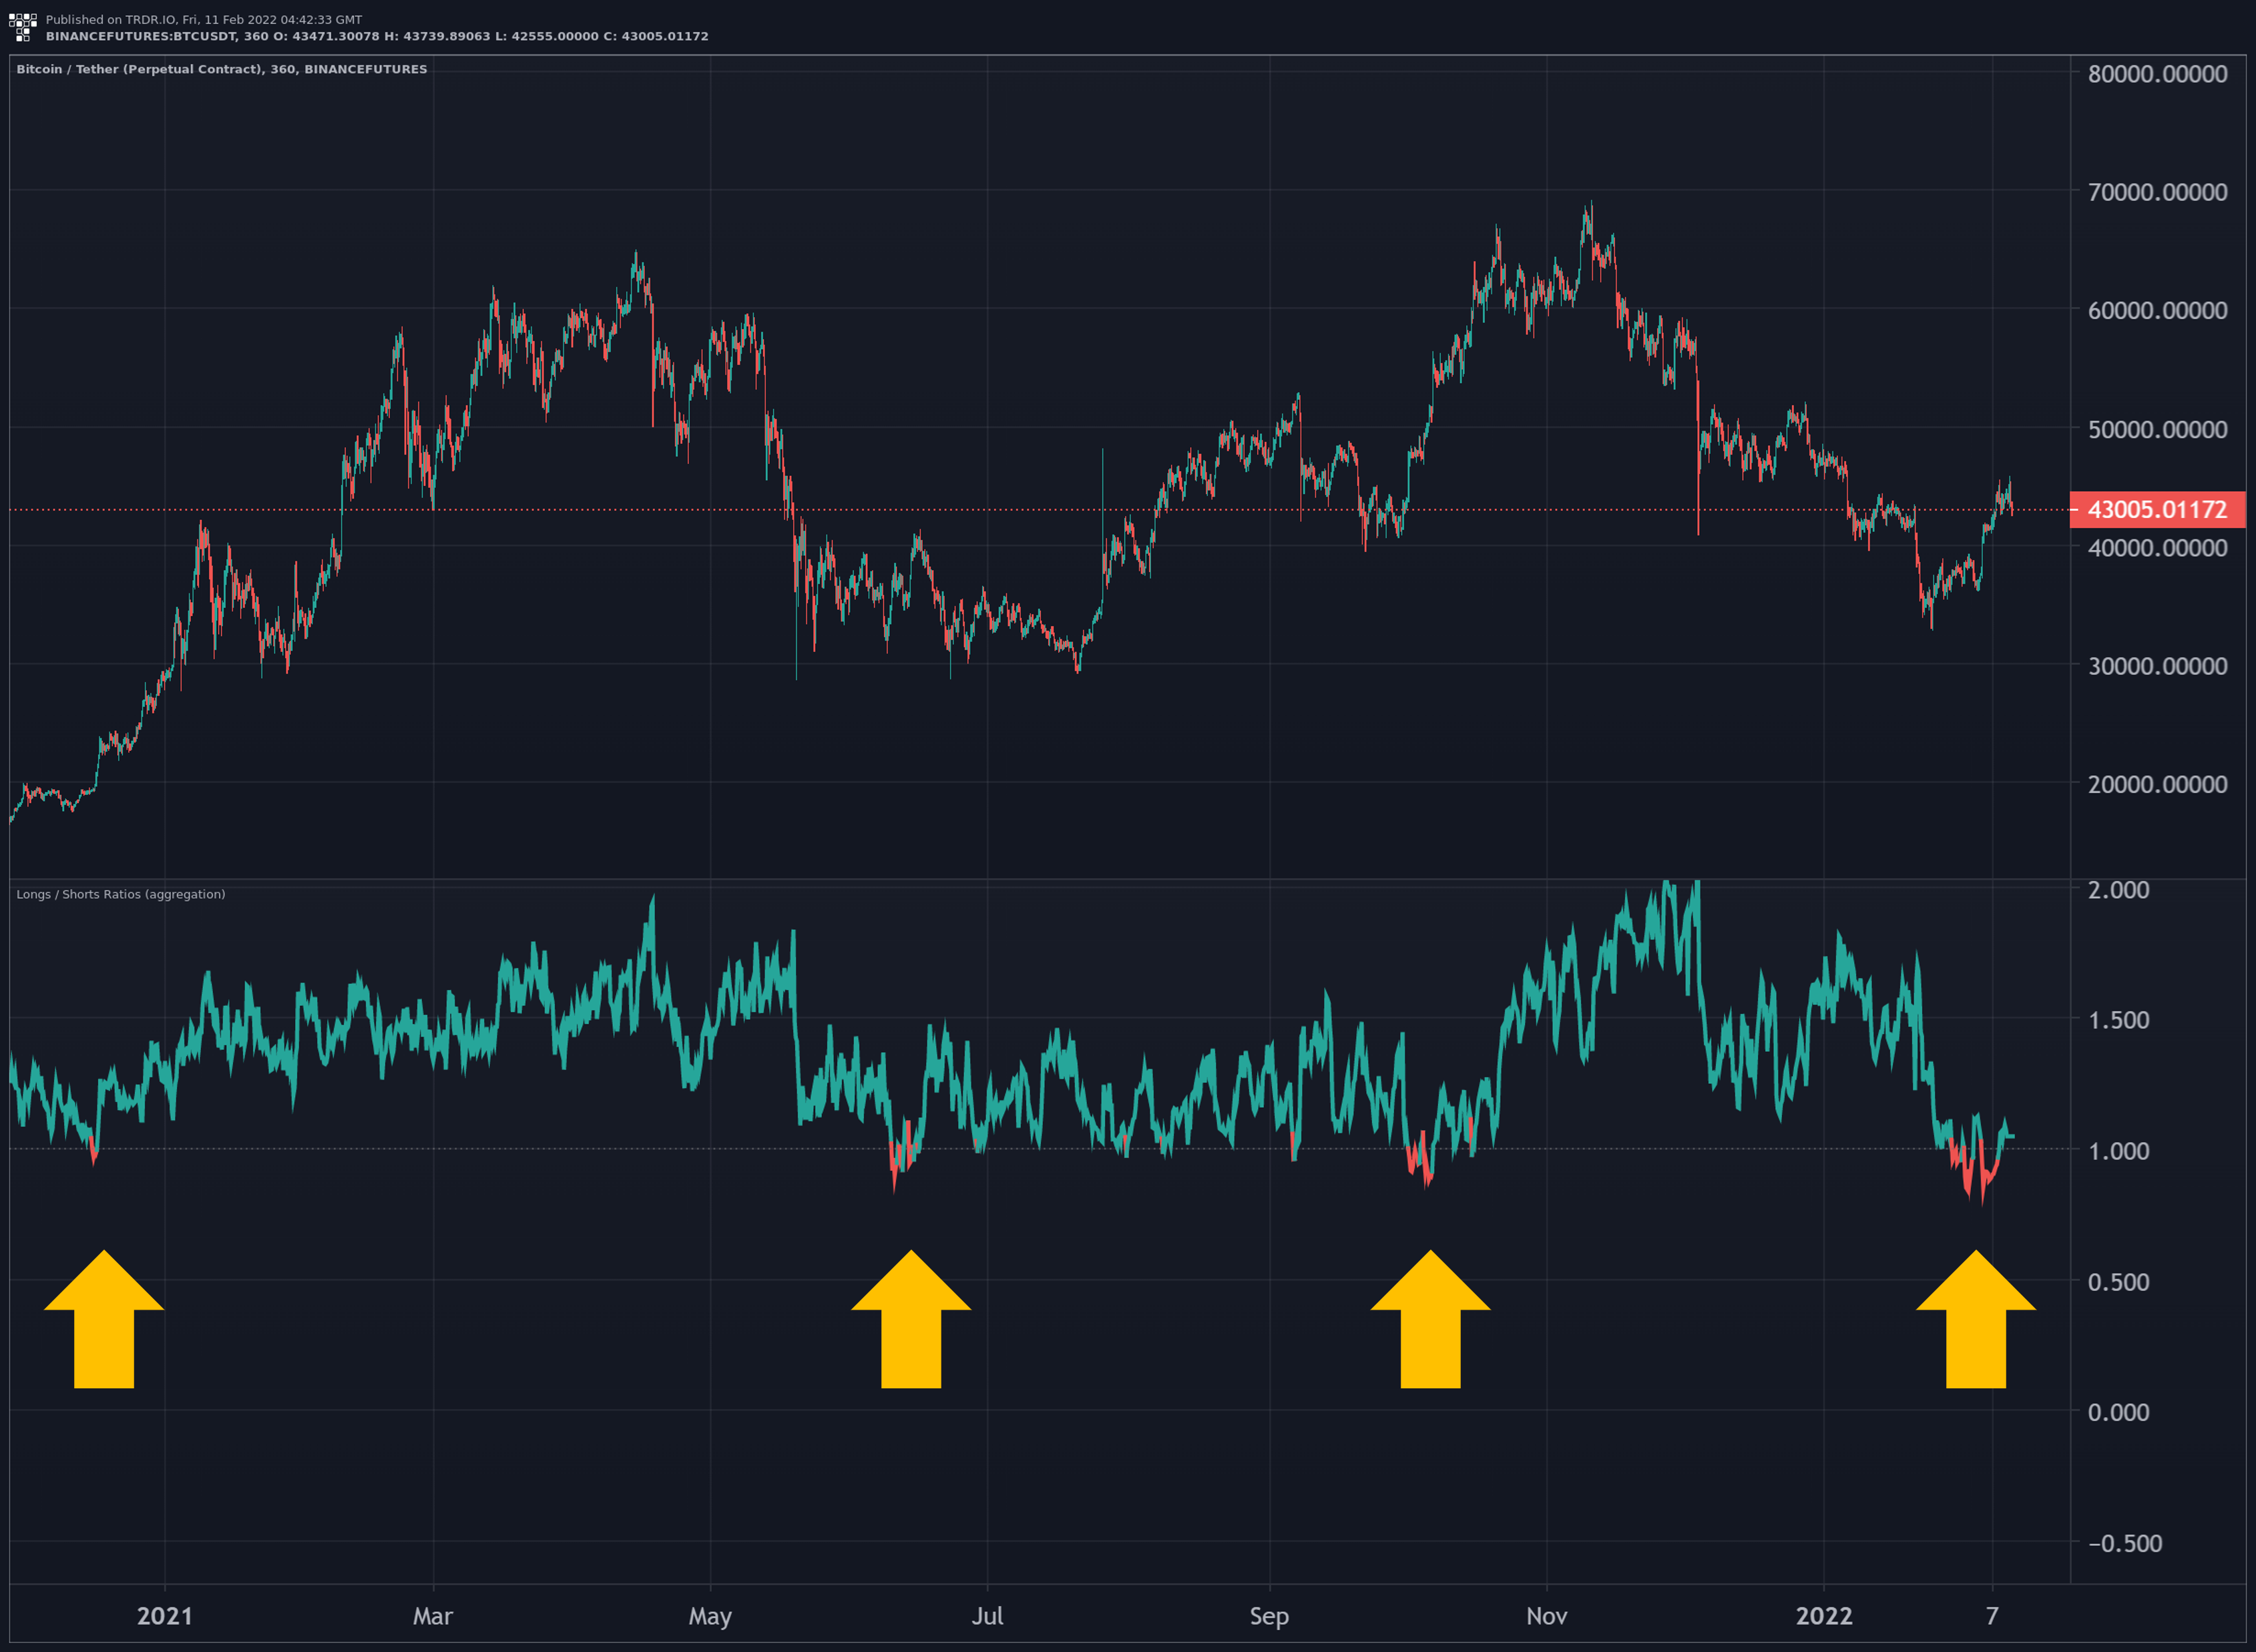
Figure 4: Longs/Shorts Ratio going negative has preceded $BTC price rallies over the past 18 months.
Predator Higher Timeframes Look Stronger
After months of indicating that Bitcoin was in a continued downtrend, high time frames on Predator (3D and 1W) are finally signaling a potential bullish trend opportunity:
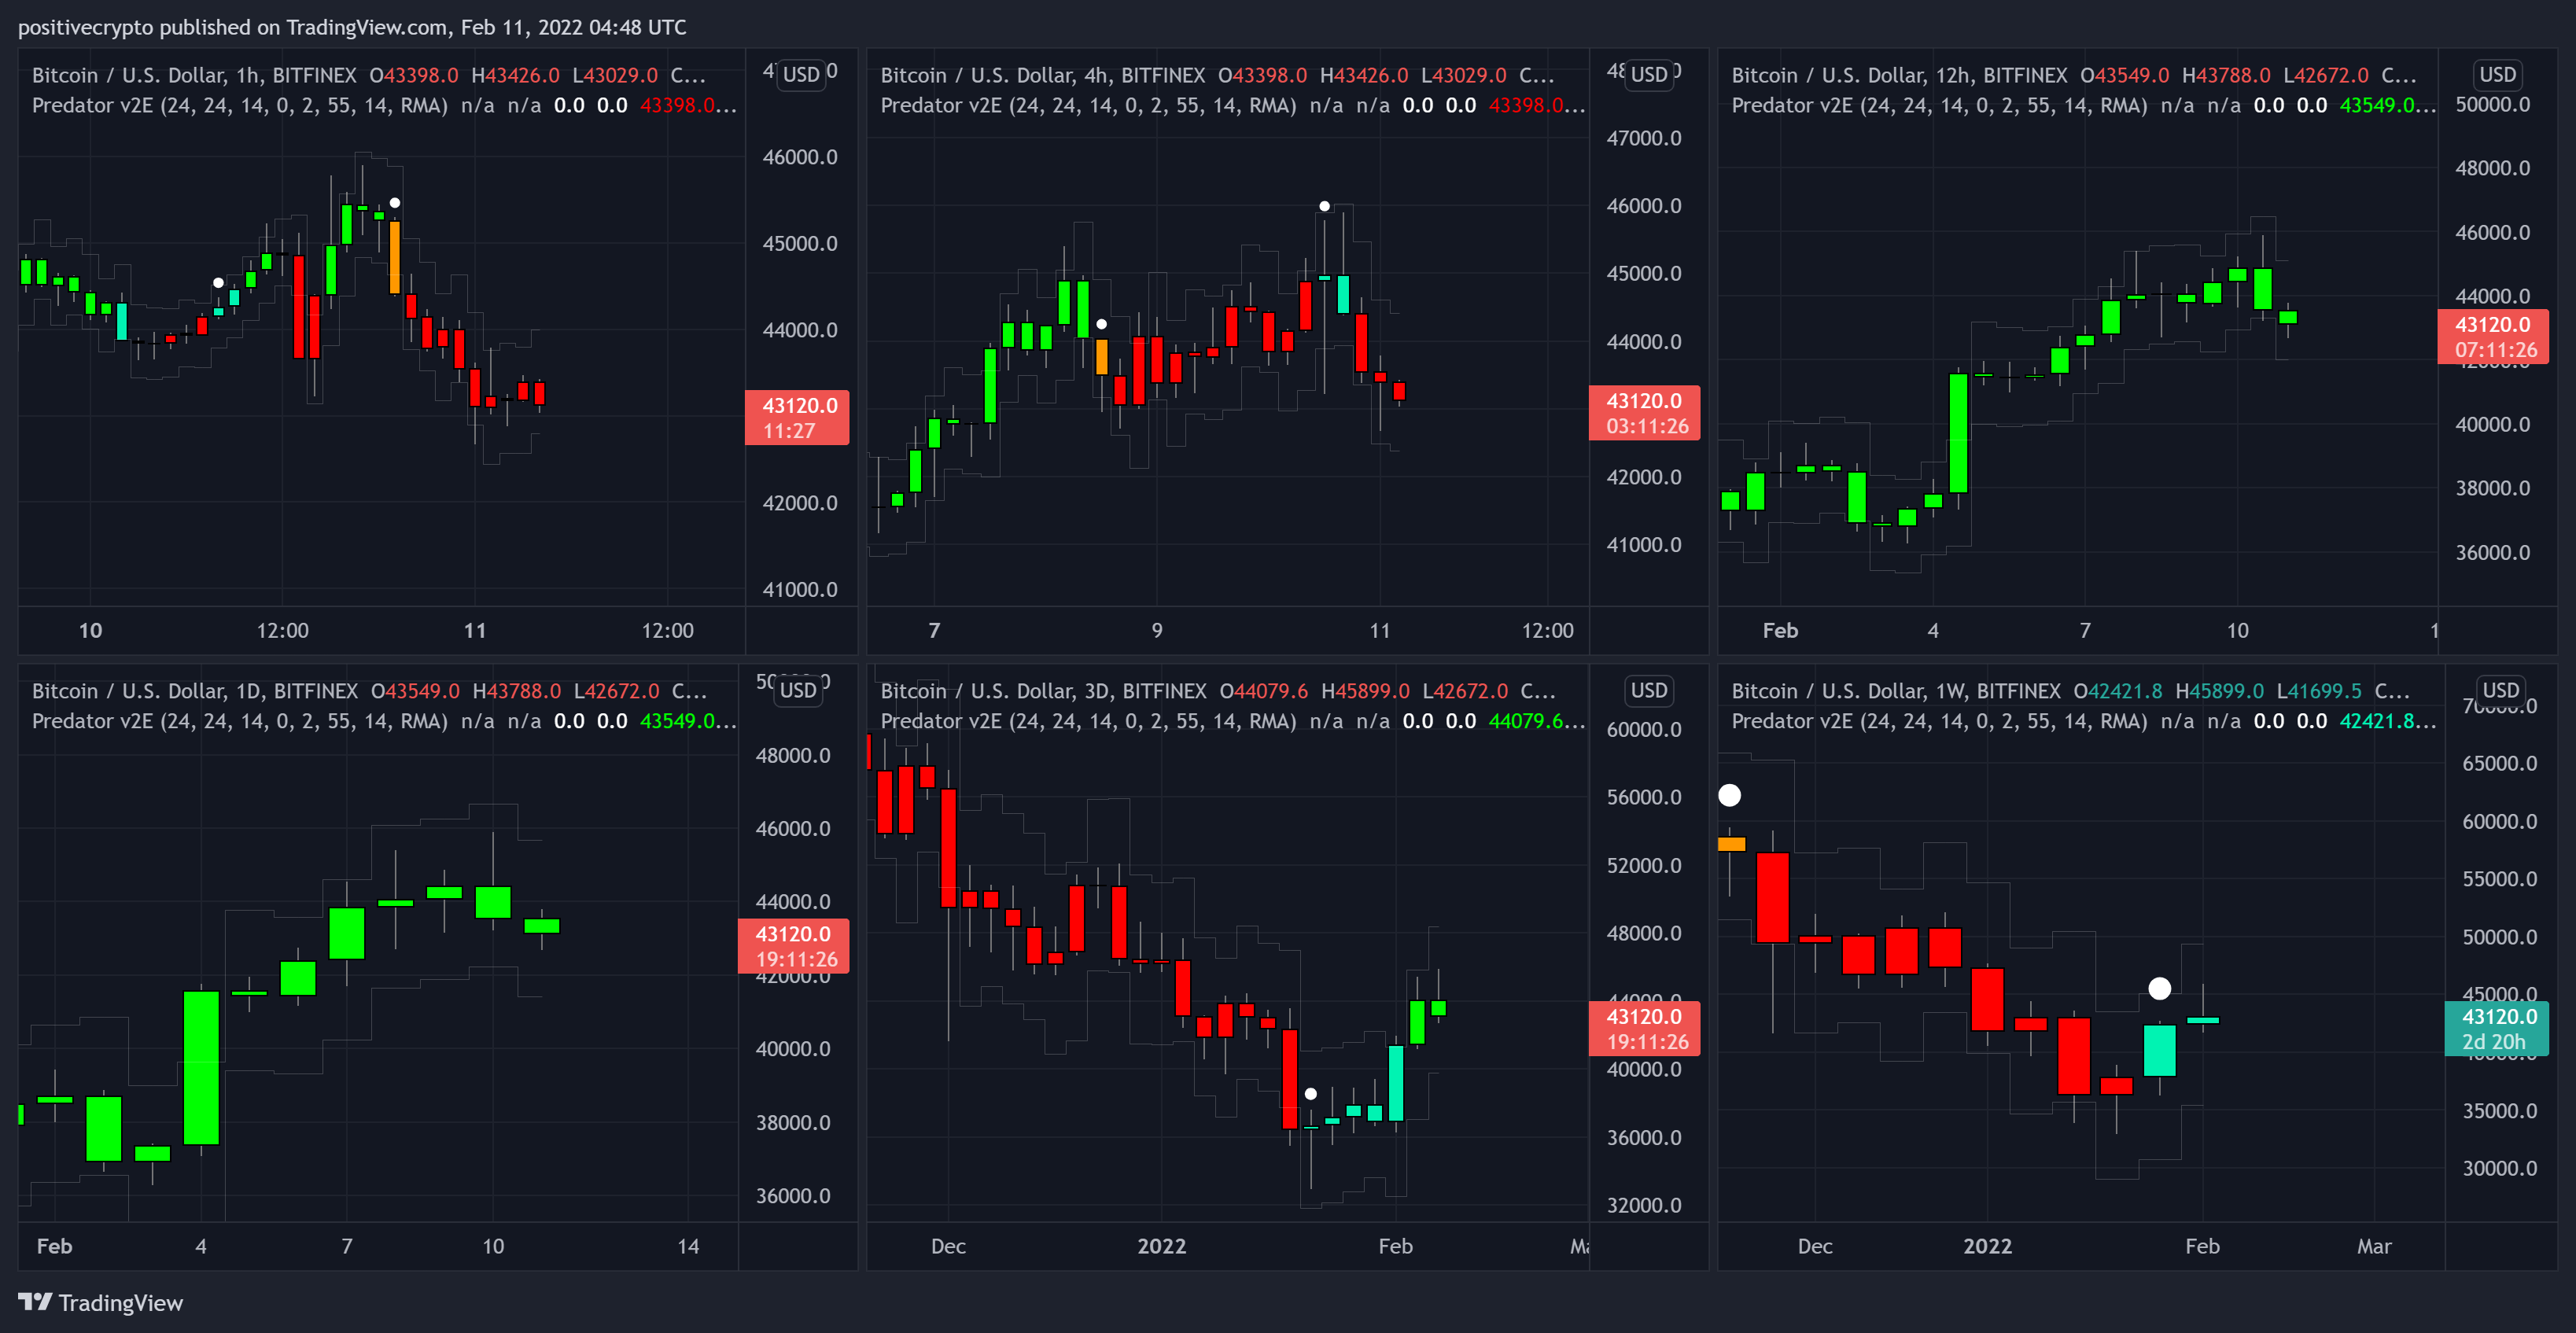
Figure 5: High time frames on Predator have turned bullish.
It is worth noting, however, that lower timeframes have flipped bearish as Bitcoin struggles to move beyond the $45,000 level. So caution may be required for late bulls looking to enter the market in the near term.
Current Predator breakdown across timeframes:
- 1hr: Bearish
- 4hr: Bearish
- 12hr: Bullish
- 1D: Bullish
- 3D: Bullish
- 1W: Bullish (Teal)
Key Support and Resistance Levels To Watch
Bitcoin is at a relatively neutral level with clear zones of resistance and support above and below.
Having just lost the Moonraker mean reversion line in the past 48hrs, should a downtrend continue on high time frames, the next significant support is $39,000, which would be a test of the resolve for bulls as price drops sub $40,000.
To the upside, there are resistance levels on either side of the important point of breakdown from the summer crash at $47,950 and $52,660.
Further out, the final boss for the bulls to defeat will be at the round number of $60,000, which is also the lower high from May last year, as well as Moonraker resistance.
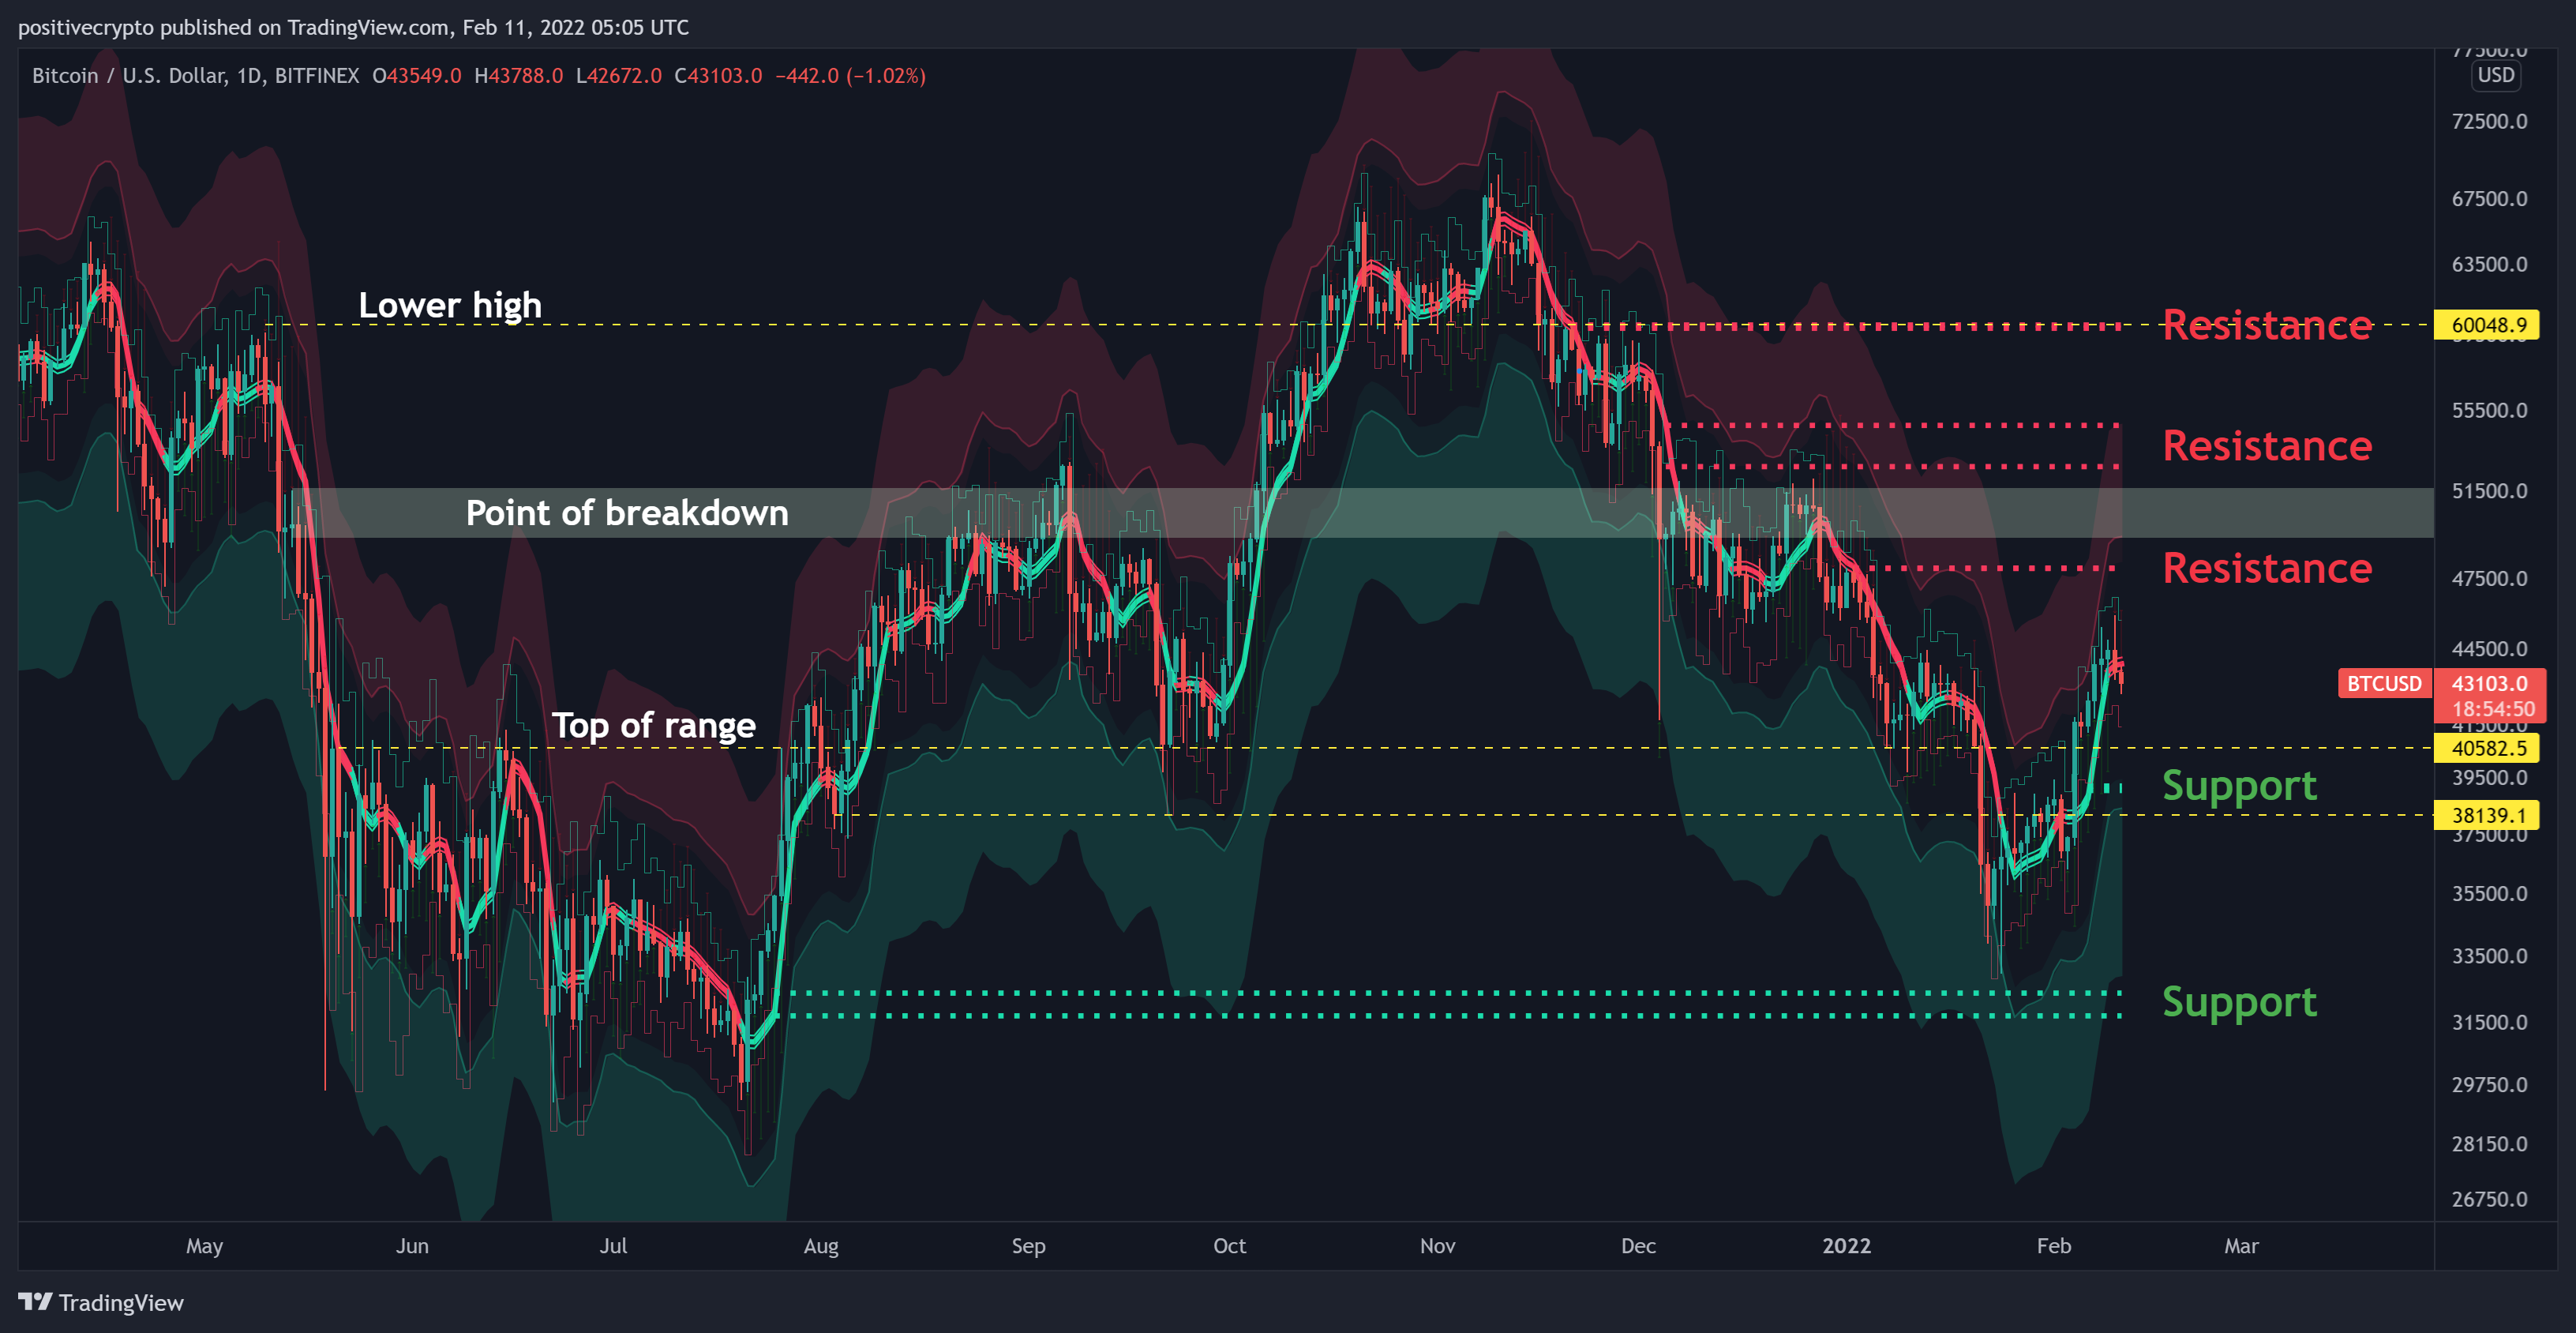
Figure 6: Moonraker key support and resistance levels.
Free Indicator For Predator Users!
We have just launched our new tool, Predator Thermal Vision. It shows Predator across timeframes for 50 of the largest Crypto assets. It is a free upgrade for all ongoing Predator subscriptions and we have back-dated access to all one-time purchases since 2021.
Importantly, the upgrade is included with all future purchases and subscriptions and also includes the Decentrader Toolkit. So if you don’t have Predator yet, you will now also get Predator Thermal Vision and the Decentrader Toolkit when you buy Predator.
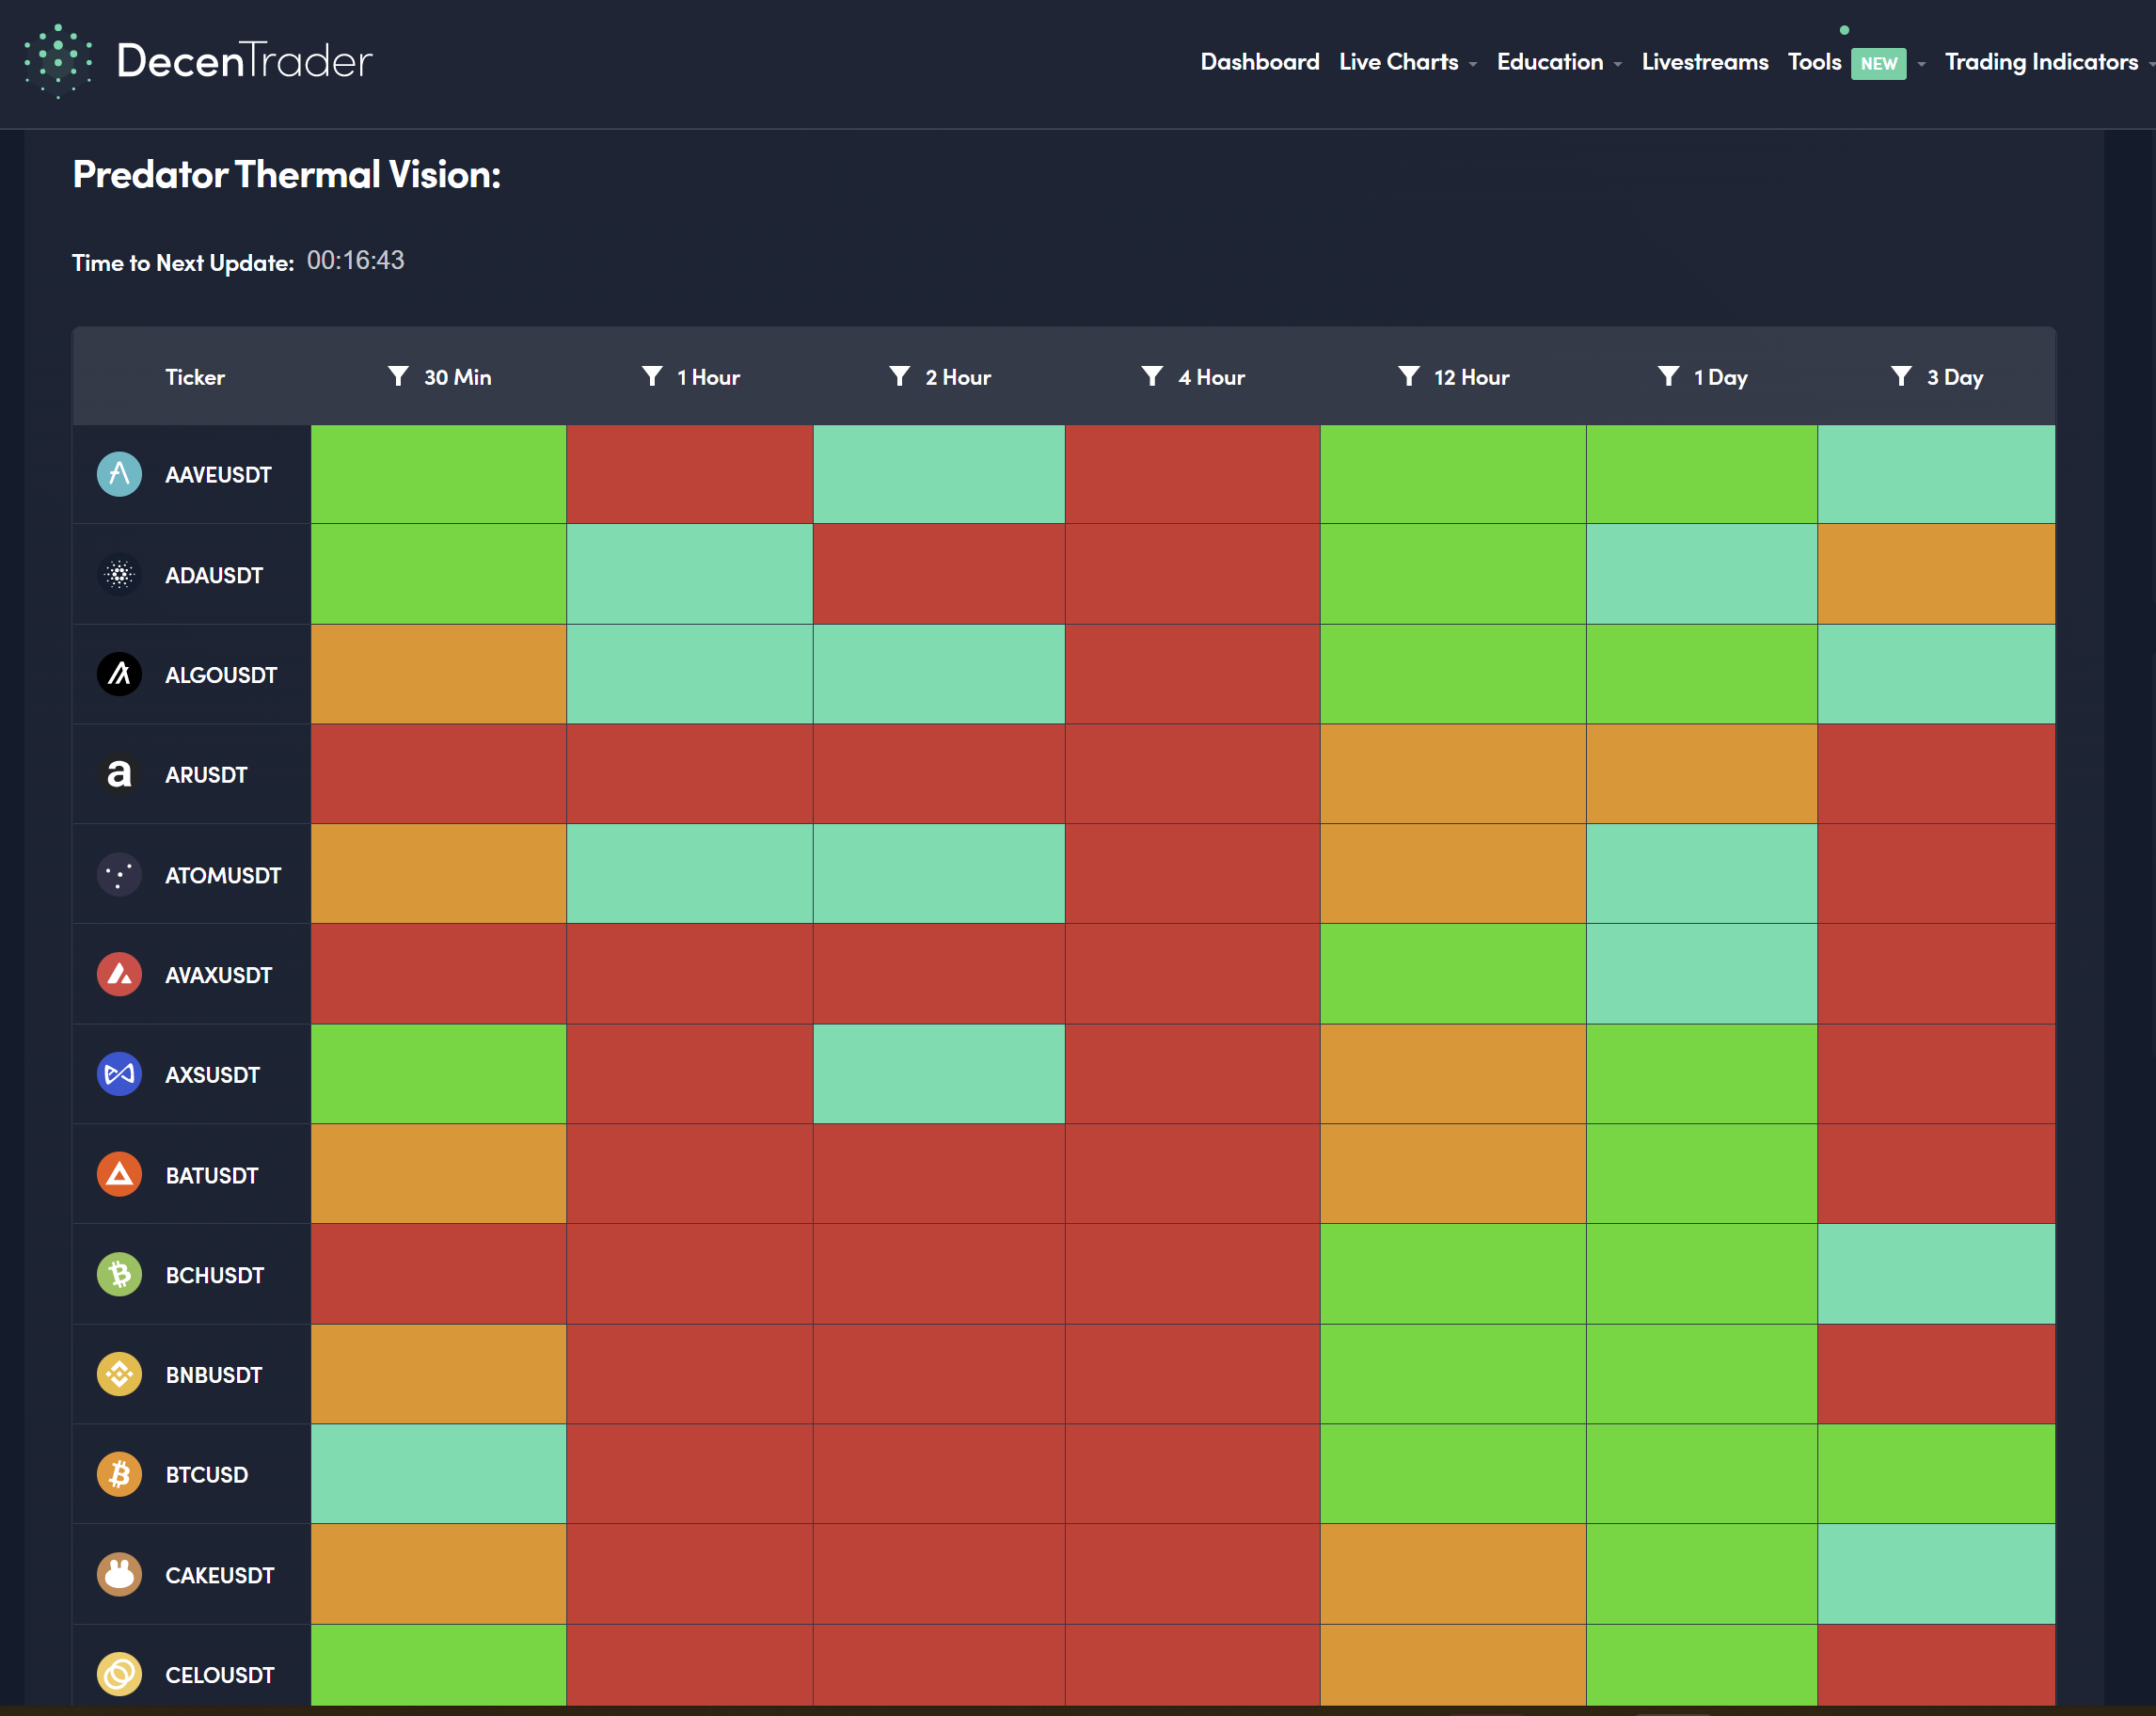
Why is Predator Thermal Vision So Useful?
Instead of trawling through loads of Tradingview charts, with Predator Thermal Vision you can quickly see which coins are strongest on higher time frames, or spot potential trend reversals when the 30min and 1hr diverge from higher timeframes.
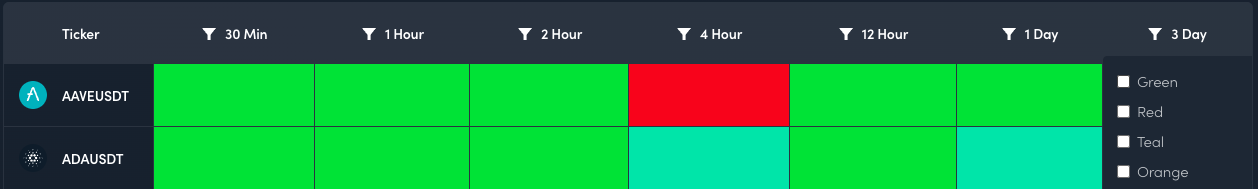
You are also able to filter each time frame to view select specific Predator outputs. This allows you to see which assets have a particular Predator signal (e.g. Green Bullish) on specific timeframes:
This greatly reduces the time required to individually check 50 of the largest coins for the best opportunities in the market!
You can purchase Predator indicator HERE to also get access to the NEW Predator Thermal Vision Tool and the Decentrader Toolkit.
Speak again soon!
Disclaimer: Nothing within this article should be misconstrued as financial advice. The financial techniques described herein are for educational purposes only. Any financial positions you take on the market are at your own risk and own reward. If you need financial advice or further advice in general, it is recommended that you identify a relevantly qualified individual in your Jurisdiction who can advise you accordingly.


