Bitcoin continues its climb to new highs and Prices unseen since January 2018
Bitcoin’s underlying fundamentals have not looked so good in a very long time.
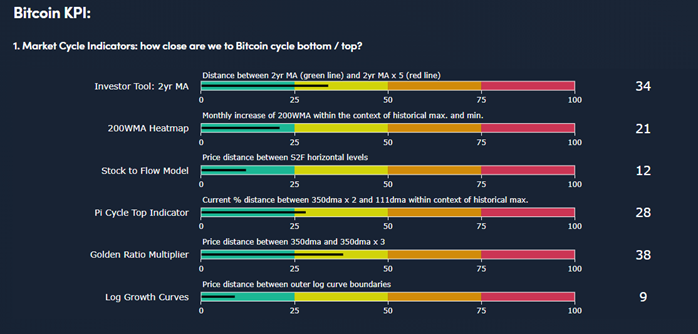
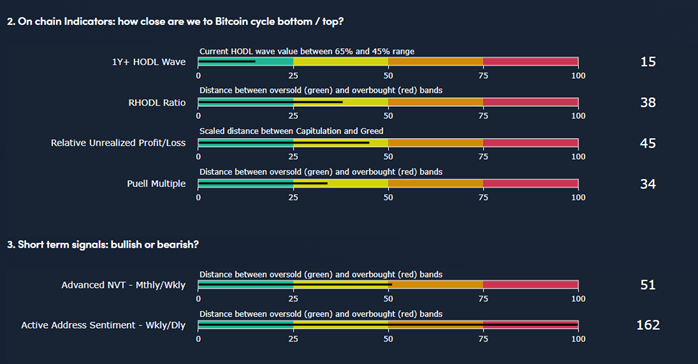
On chain and cycle indicators continue to show strength as can be viewed on the Decentrader Live Charts and Our New KPI report which we will be releasing shortly to aid with key investment decisions but can be previewed below.

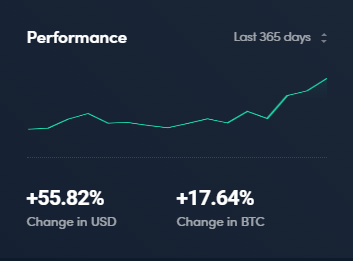
Decentrader Transparency
We have had a good run on the Decentrader account over the last 7 Days, outperforming the market while maintaining low risk and volatility through the turbulence. You can follow the trades associated with this account by subscribing HERE.
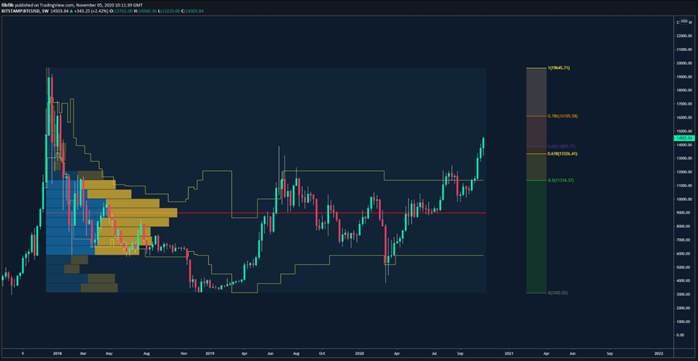
Technicals
Bitcoin’s Strength has come from the momentum largely on the spot market since breaking the 50% fib level which was largely the top of the trading range in the previous 2 years with the exception of the blow off top. There is little resistance to the next key fib level. At the 78.6% or c.16k
We have taken profit on leverage now at this point in the run up with the exception on intraday scalps, and are enjoying the ride today.
https://www.tradingview.com/x/gC1HzGPc/
Weekly
When compared to the previous cycle, the Bitcoin Weekly chart, if Bitcoin were to repeat price action from the previous cycle, a blow off to all time highs is not out of the question.
Should this occur and history is to Rhyme, in the previous cycle the 61.8% fib returned as support at around $770, something similar this time would see $13k become an important level and potential buy the dip opportunity.
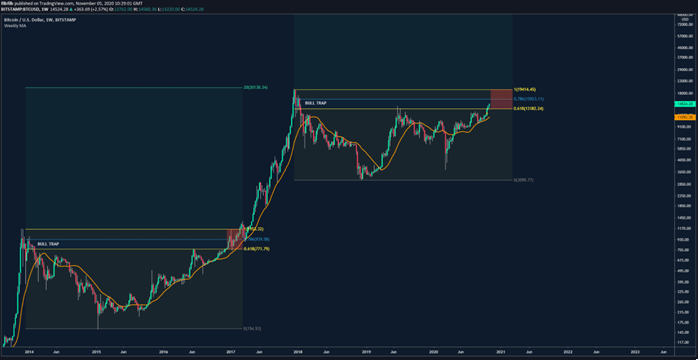
https://www.tradingview.com/x/MGNIkNSS/
Daily
The daily chart being used alongside the Predator system has been fantastic in managing entries and exits lately as can be seen on the below chart. We have however taken some profits on leverage as mentioned as we approach the first of the key fib multiplier levels from our investor toolkit.
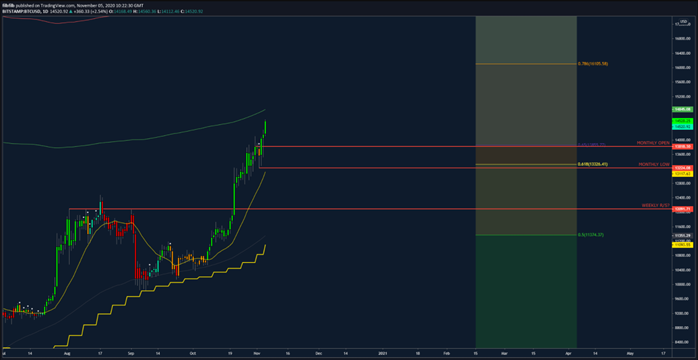
https://www.tradingview.com/x/wytGBhhZ/
4 hour
The 4 Hour chart illustrates that November monthly open ($13818) and low and 20 DMA ($13320) levels are likely to act as first lines of defence should there be a pull back, with the 20 WMA bein now at $11k if we were to see something more significant.
This move has been and continues to be driven by the Spot market demand which has been continued absorbtion of any selling pressure into the book which is also mirrored on the derivative markets showing in the funding and general order flow.
Volume has remained bullish as can be seen by the OBV breakout.
While all of these things remain true, we remain long at spot.
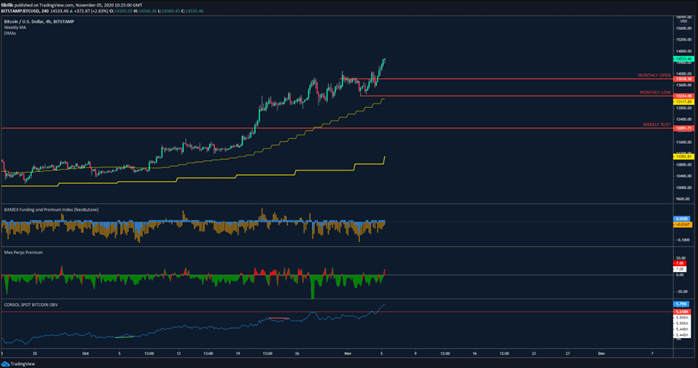
https://www.tradingview.com/x/fA666ItG/
Disclaimer: Nothing within this article should be misconstrued as financial advice. The financial techniques described herein are for educational purposes only. Any financial positions you take on the market are at your own risk and own reward. If you need financial advice or further advice in general, it is recommended that you identify a relevantly qualified individual in your Jurisdiction who can advise you accordingly.


