Decentrader Market Update – Pivotal Pivots.
Bitcoin has continued its high beta correlation with Equities as mentioned in my previous update as shown by the below chart.
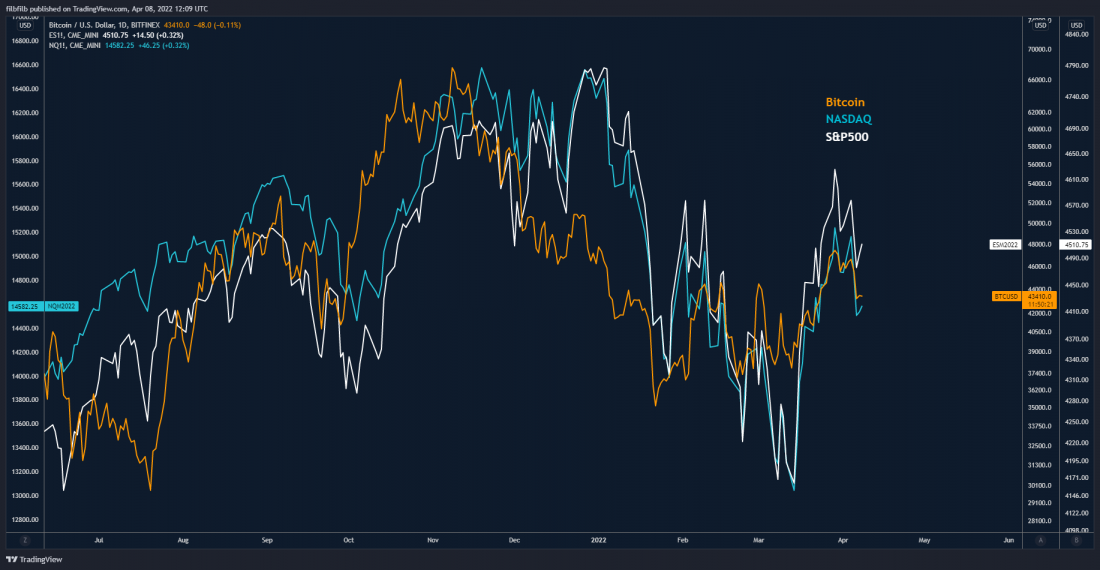
Bitcoin / NASDAQ / S&P500 Correlation
Looking back over previous years, it is apparent that Bitcoin has seen sharp corrections with major market events such as COVID, the Russia-Ukraine conflict and China-US trade uncertainty. These V shape corrections for the NASDAQ, have previously seen the reclamation of the 50 DMA, helping to form an inverse head and shoulders and go on to make all-time highs for both the NASDAQ and Bitcoin. We find ourselves back at the 50 DMA once again and in this potential scenario for Bitcoin.
Sleeping on the legacy markets action does not seem like a smart thing to do on either low or high timeframes, with particular attention relevant to the present scenario.
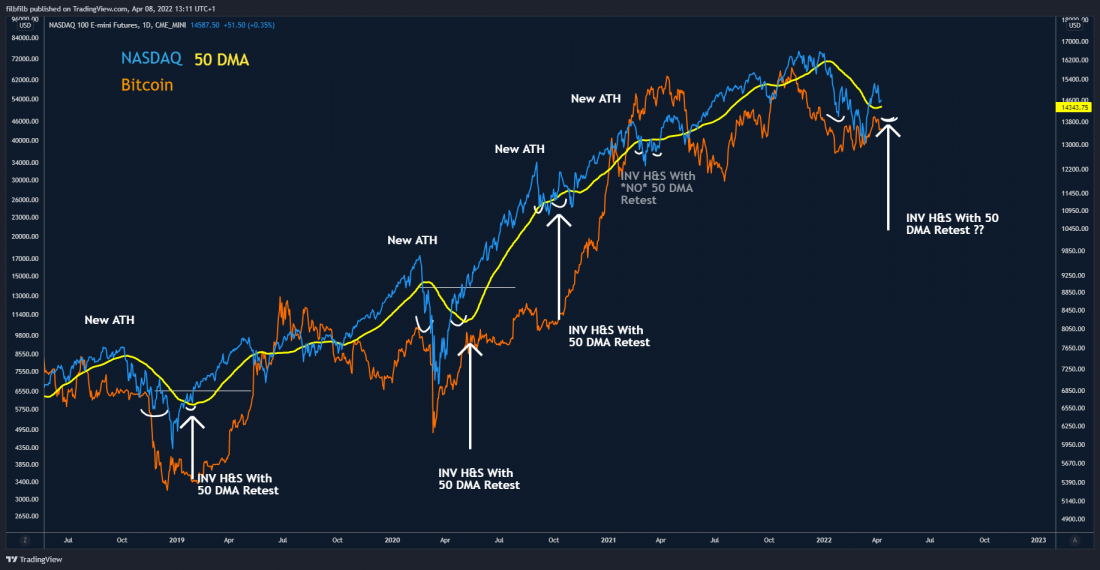
Bitcoin / NASDAQ / S&P500 Correlation
Looking at Bitcoin in isolation and as per a tweet thread i shared last week,
Assuming there is some form of resistance between here and around $50k, a backtest of the 20 WMA would be the critical point for the buill/bear market and / or a HTF close above the yearly pivot.
— filbfilb (@filbfilb) March 28, 2022
Yearly Pivot
Bitcoin was rejected off the Yearly Pivot, a level which has not been broken in either of the last 4-year cycle bear markets. This, although highly probable, was a disappointment for the bulls which had an injection of hopium, having broken the major weekly support/resistance level of circa $43k.
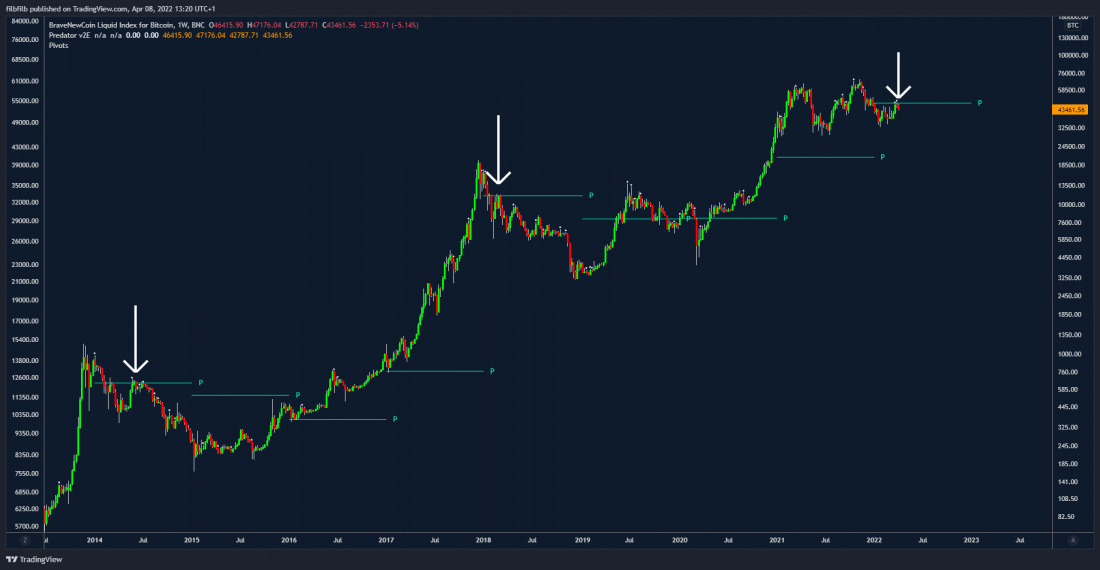
Bitcoin Yearly Pivots
Predator 3 Day and Market Sentiment.
The Predator 3 Day chart has remained bullish and above the 50 DMA which has previously been a very bullish outcome for Bitcoin, however, we would expect the chart to turn bearish with a few periods closes below the 50 DMA, which would also mean closing below the key weekly level of $43k.
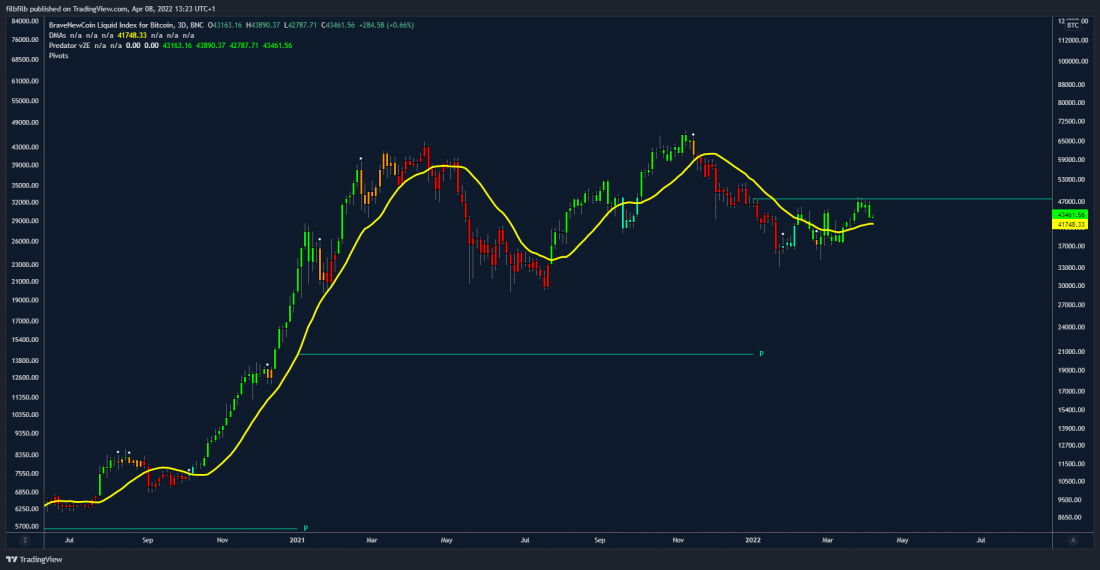
Bitcoin 3 Day chart with Predator Overlay & 50 DMA
You can purchase the Predator Indicator here.
Looking at the Funding, Open interest, and Long / Short ratio to gauge an idea of what is happening as price retraces, we can see over the last 3 days that Bitcoin’s open interest has fallen as the price has retraced which is to be expected and that the weighted average funding rate still remains relatively low, which is overall ok as a market sentiment gauge, however, we have seen a relatively big increase in the ratio of participants that are increasing and price decreases which is generally bearish. This ratio is now at 2.1 meaning 2.1 people are long for every 1 person short.
This analysis page is free to use on the Decentrader site.
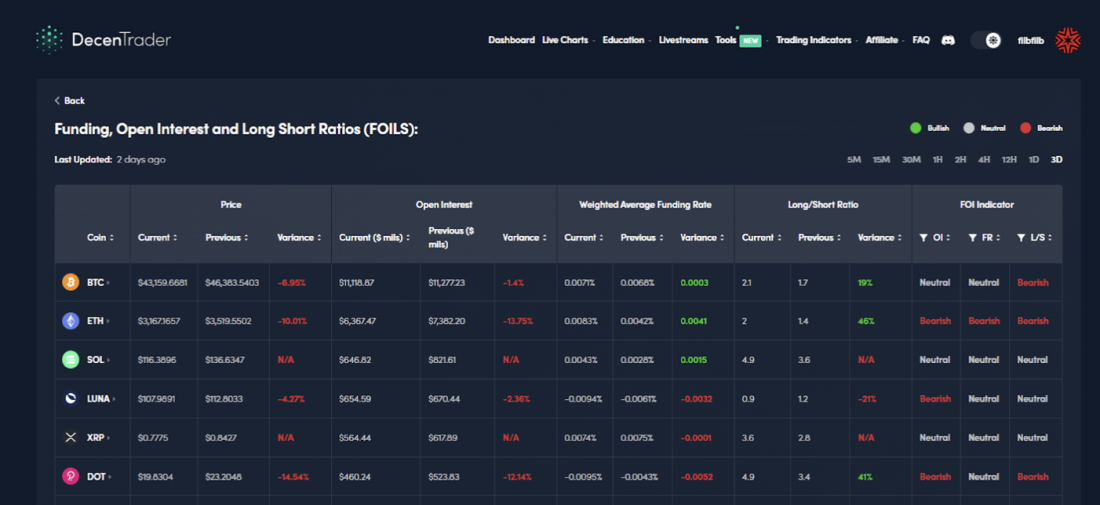
Decentrader Funding, Open interest and LS ratio Tool
Low Timeframe Analysis.
Short term, Bitcoin is below the Moonraker/mean reversion line, showing that the uptrend has been broken. Often price will revert to the mean, which is currently sitting around $45k, however, there is a bear flag forming which would take us to the MR support level at $40.5k, if the bearish target is met. This is all taking place around the Key Weekly level, so if it does occur, for Bitcoin to remain in its bullish posture, we would really need to see a reversal and reclaim of the weekly $43k level. MR resistance has printed just below the Yearly Pivot at $46.7k.
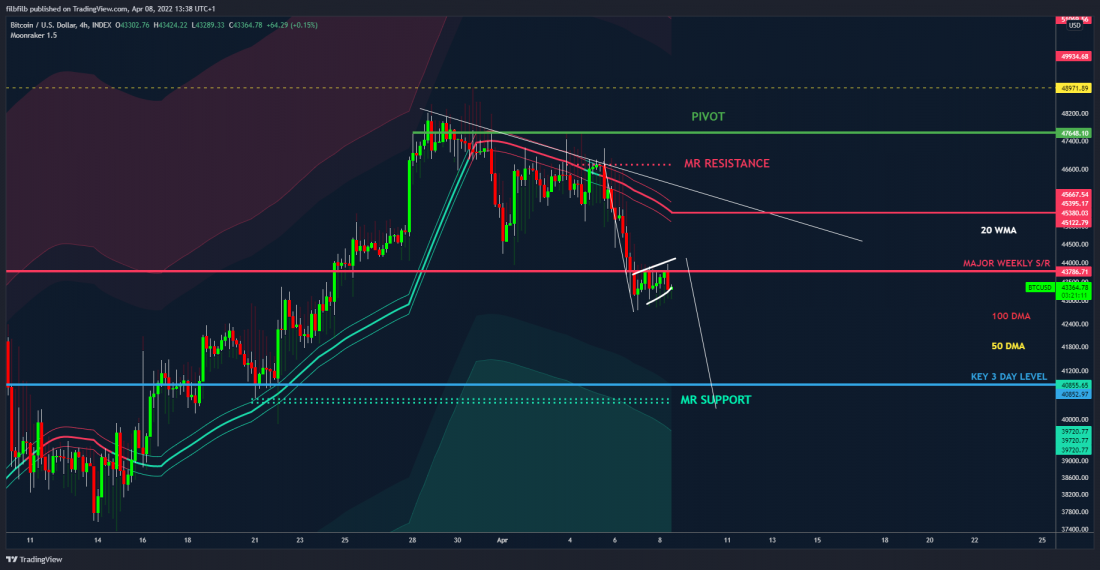
Bitcoin 4 Hour Chart with Moonraker Overlay
You can purchase Moonraker Indicator here.
Looking at the likelihood of a breakdown, using the Decentrader liquidity and funding tool, we can see that there lies a chunk of liquidity below which may assist in driving the market south (at least in the short term), assuming the market continues to be bullish with falling prices. The risk of tapping into some of this seems relatively high, given that a lot of traders will have been lulled into a false sense of security with last week’s bullish candle.
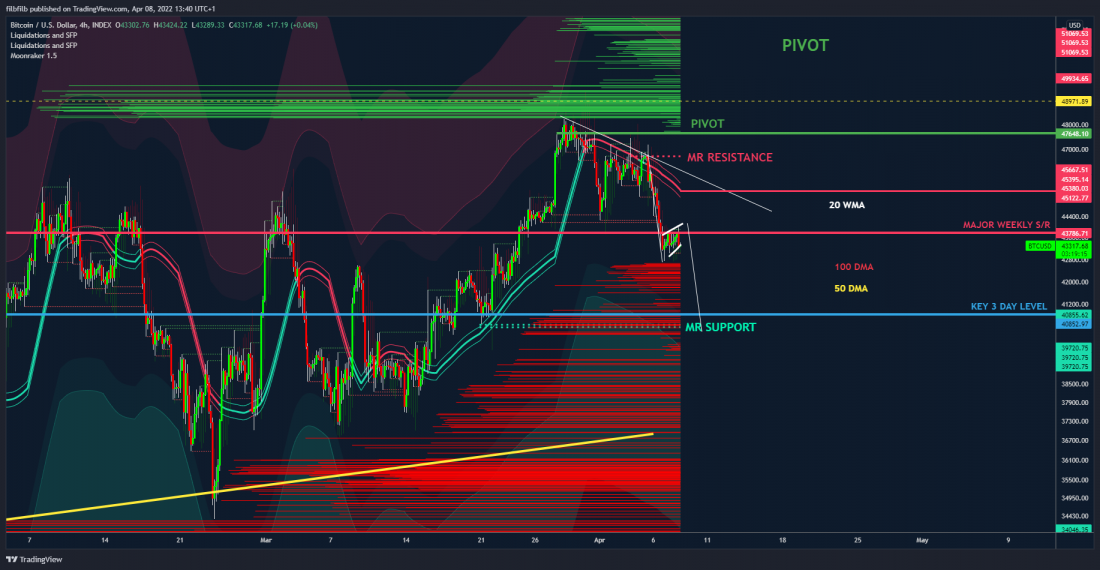
Bitcoin 4 Hour Chart with Moonraker Overlay & Liquidity and SFP tool
Similarly, we can see that there is a stack of liquidity sitting north of the Yearly pivot, so a break above that may result in a powerful move up towards the consolidation target of $53-5k.
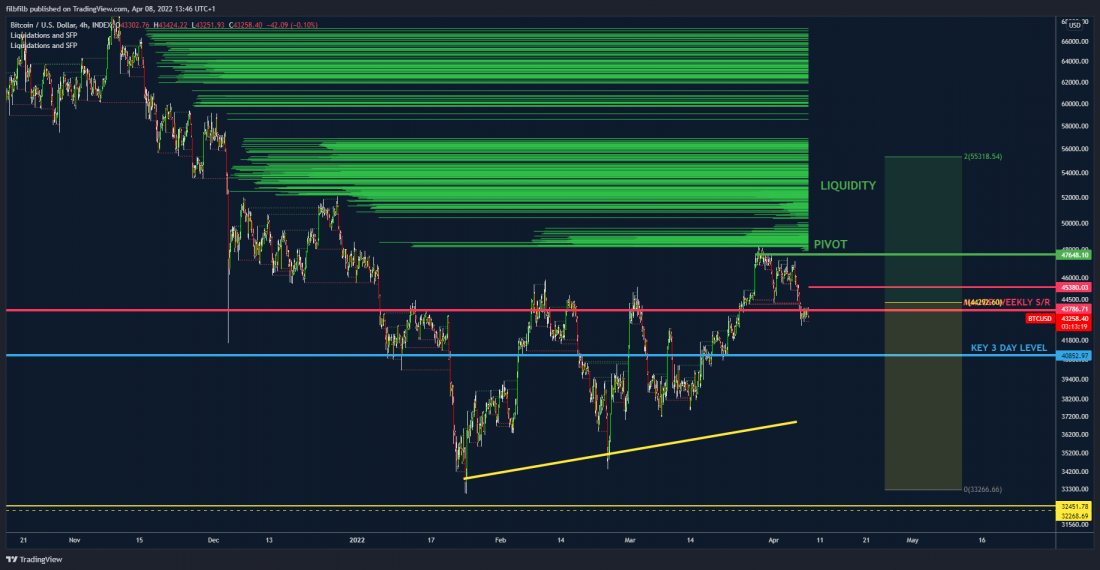
Bitcoin 4 Hour Chart with Liquidity and SFP tool
Summary
Overall, Bitcoin is, as the title of this analysis suggests, at a pivotal point. The correlation to the equities market which now faces increasingly hawkish sentiment and actions by the Fed, coupled with the key technical levels of the weekly support and yearly pivot, is indeed pivotal for Bitcoin and likely to define price action for months to come.
A break above the yearly pivot would be a break from the 4-year cycle norm and could suggest that Bitcoin will be on the way to significantly higher prices, but for the immediate term, the weekly level needs to be supported by the bulls, to avoid dropping back into consolidation.
Disclaimer: Nothing within this article should be misconstrued as financial advice. The financial techniques described herein are for educational purposes only. Any financial positions you take on the market are at your own risk and own reward. If you need financial advice or further advice in general, it is recommended that you identify a relevantly qualified individual in your Jurisdiction who can advise you accordingly.


