Bitcoin $85,000 Next Major Target
With the exception of a brief fakeout, Bitcoin has continued to broadly consolidate under major resistance for nearly six weeks now.
This week has been notable because many day-traders were caught offside as $BTC was chopping below the 200 day moving average (purple line) for several days. This is despite there being clear daily support at $44,000 which has held throughout.
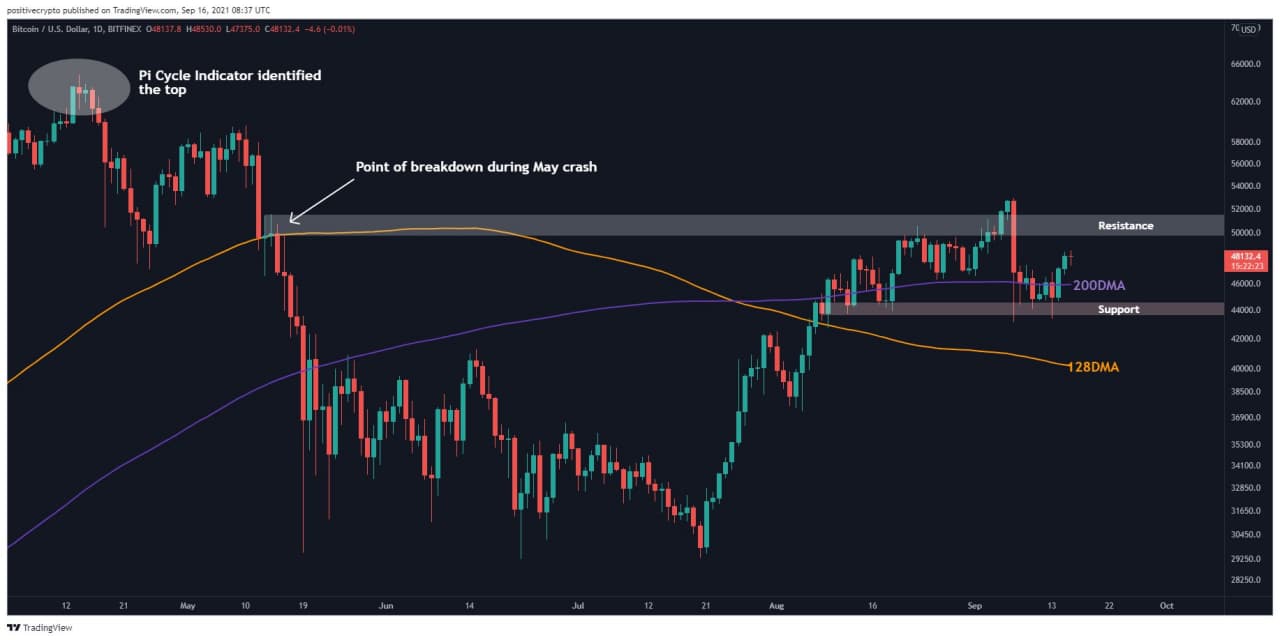
Figure 1: Bitcoin broadly consolidating between $44,000 and $50,000 the past month
Funding rates have helped to highlight that many day traders were offside as we saw funding go negative across derivative exchanges yesterday as price ran up and closed above the 200 DMA.
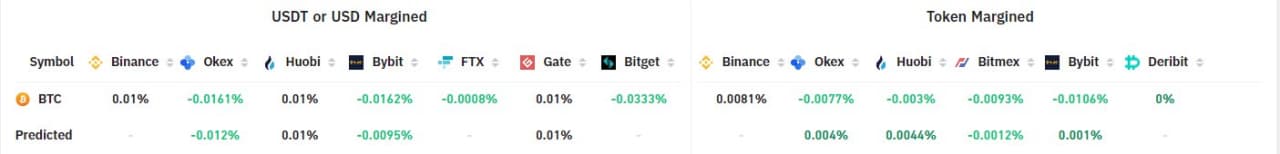
Figure 2: Negative funding on both USDT and token margined BTC derivatives yesterday
At the time of writing, funding remains negative across several exchanges. Given that we see a bullish context elsewhere for $BTC, we believe there is potential for a further squeeze to the upside in the coming days.
Why so bullish?
Both technical and fundamental factors are aligning for Bitcoin at the moment, setting up a potentially explosive Q4 for $BTC price action. Near term, the price has now reclaimed both the 200DMA and also the Moonraker Mean Reversion line. It is possible we see a retest of those levels which are currently at $46,100 before we trend up higher. It would now take a significant bad news event to move the price down to the 128DMA and Moonraker support at $40,000 – $41,000. But that would be the next clear support level should we lose the 200DMA on a daily close basis. Once we convincingly break $50,000, there is little resistance before Moonraker Indicator resistance up at $60,000.
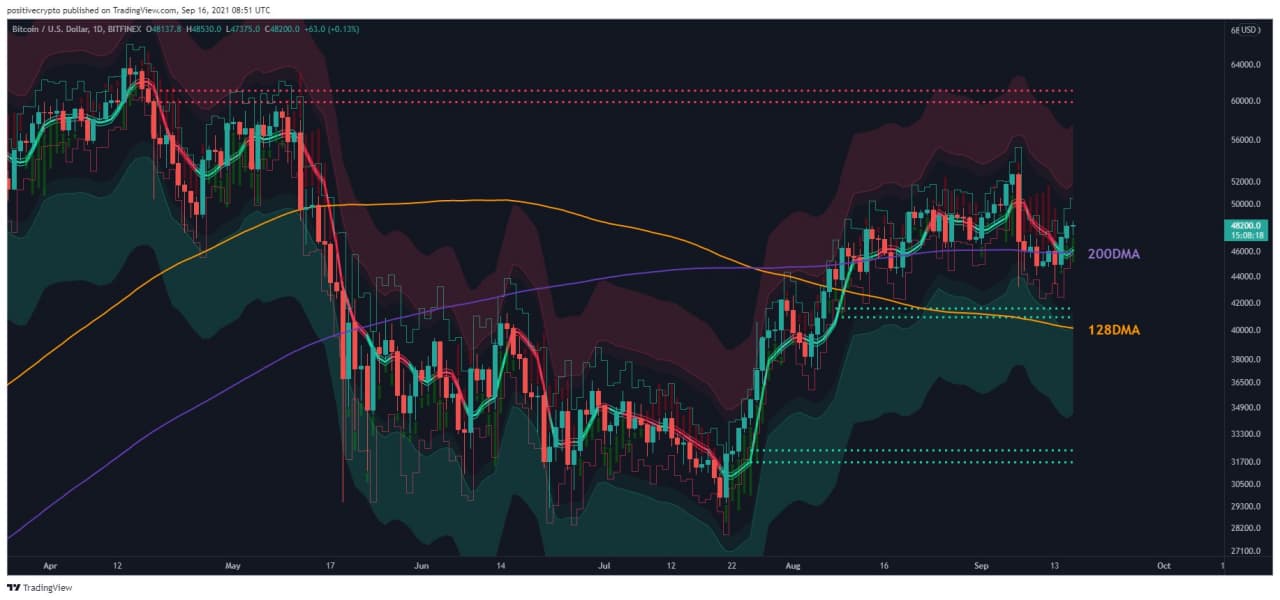
Figure 3: Moonraker highlighting key support and resistance levels
LEARN ABOUT NEW TRADING STRATEGIES WITH MOONRAKER HERE:
Active Address Sentiment Indicator
When Bitcoin made its first run up to $50,000 three weeks ago, we highlighted that this short-term indicator was signaling price may need to pull back. That was because monthly rolling price change had run ahead of monthly rolling Active Address change. So the price was accelerating too far ahead of actual Bitcoin user growth. When we look at the chart now, we see that price change (orange line) has sufficiently pulled back to the bottom of the Active Address bands (dotted green line).
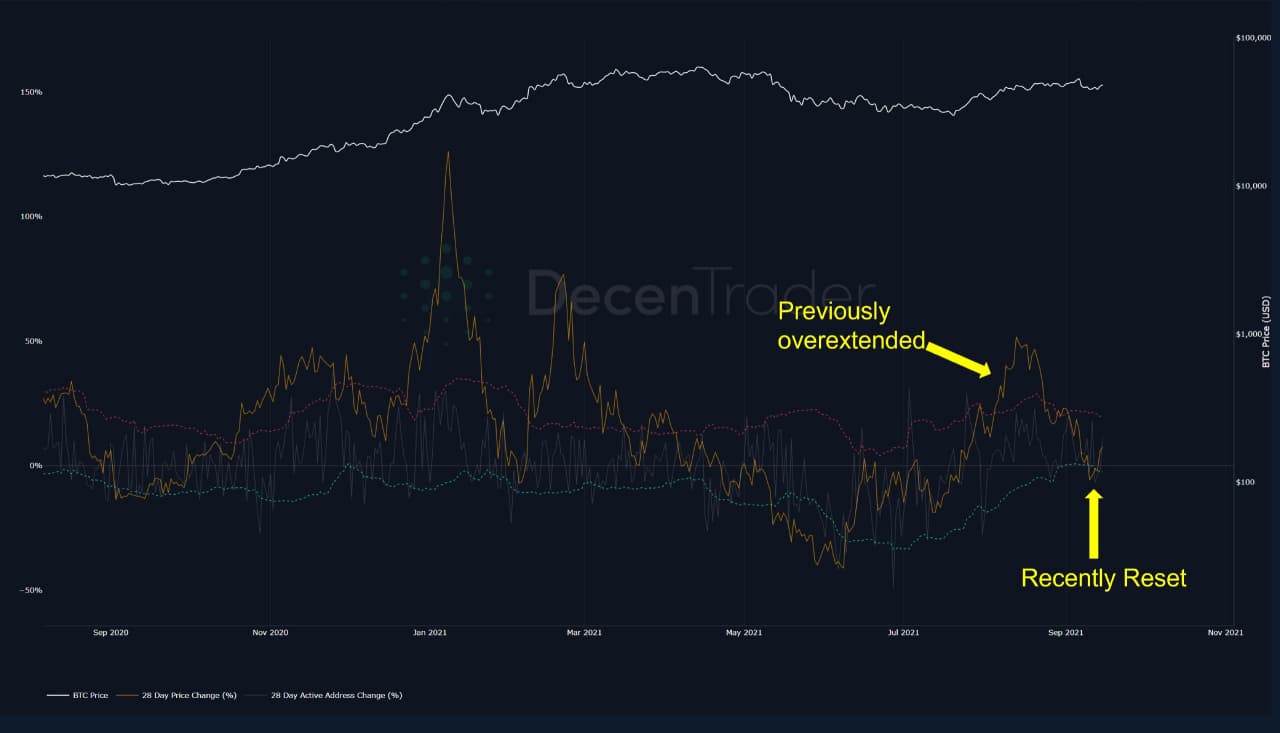
Figure 4: Active Address Sentiment Indicator has now reset with price change lower than active address change
When we see monthly rolling price change break back above this green dotted line of monthly rolling active address growth, we tend to see the price of Bitcoin increase in the following weeks as the market looks to catch up with network growth. Therefore, on a 2-4 week timeframe, this is bullish.
Spent Output Profit Ratio (SOPR)
SOPR shows us whether on-chain participants are selling at a loss (green) or in profit (red) on a given day.
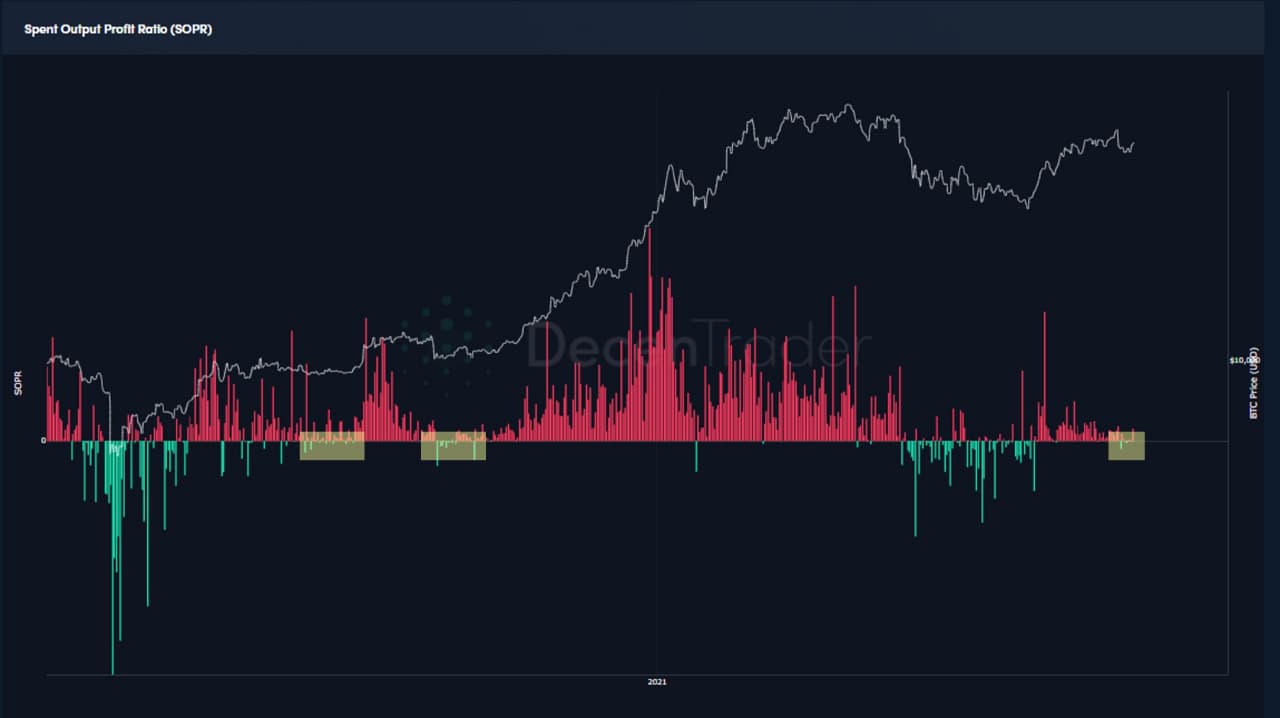
Selling at a loss paints a green candle because it can signal ‘buy the dip’ opportunities in a bull market. We are now in a similar situation to the months that followed the March covid crash. After the summer crash where SOPR was heavily printing green candles, we are now seeing some minor selling at a loss on chain on this pullback from $50,000.
This is a potential buy-the-dip opportunity as final sellers get flushed out before we move higher as we saw in Q4 2020.
Bitcoin Held On Exchanges Continues To Drop
As more people realize that we are not likely to enter a sustained bear market (as we stated throughout the summer downturn), they are taking their Bitcoin back off exchanges and putting it into cold storage. This reduction in short-term available supply is another factor that puts upwards pressure on price in the medium term. As demand increases, while supply reduces… the price goes up.
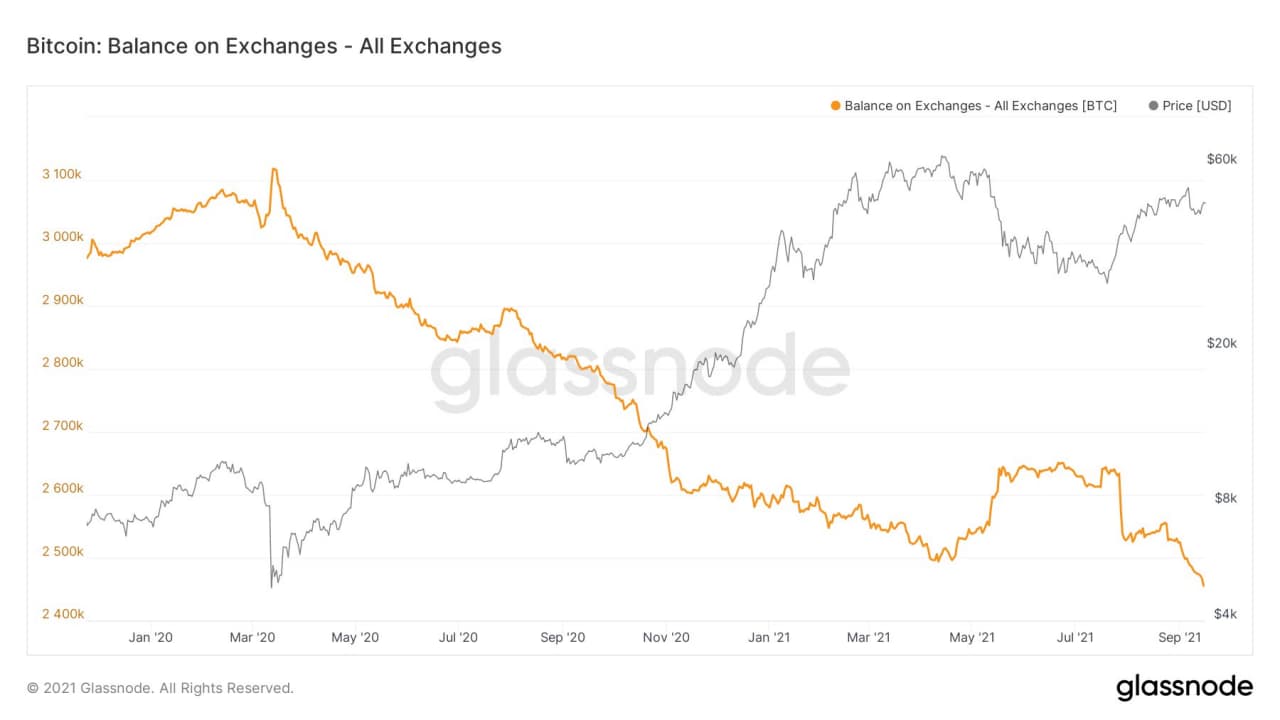
Figure 6: Bitcoin held on exchanges continues to trend down
Target over the coming weeks
Throughout Bitcoins history, $BTC price has trended bullish when above its 1yr moving average, and bearish when below it. In July we saw price briefly come back to retest the 1yr MA and $BTC has since aggressively bounced off that level. Providing further confirmation that we are not in a bear market currently.
3-Day Predator continues to identify the major moves for Bitcoin. It correctly identified that the market was topping out in the summer due to market volume issues and therefore turned red. Since the market low in late July it has been signaling a bullish trend continuation and remains green currently.
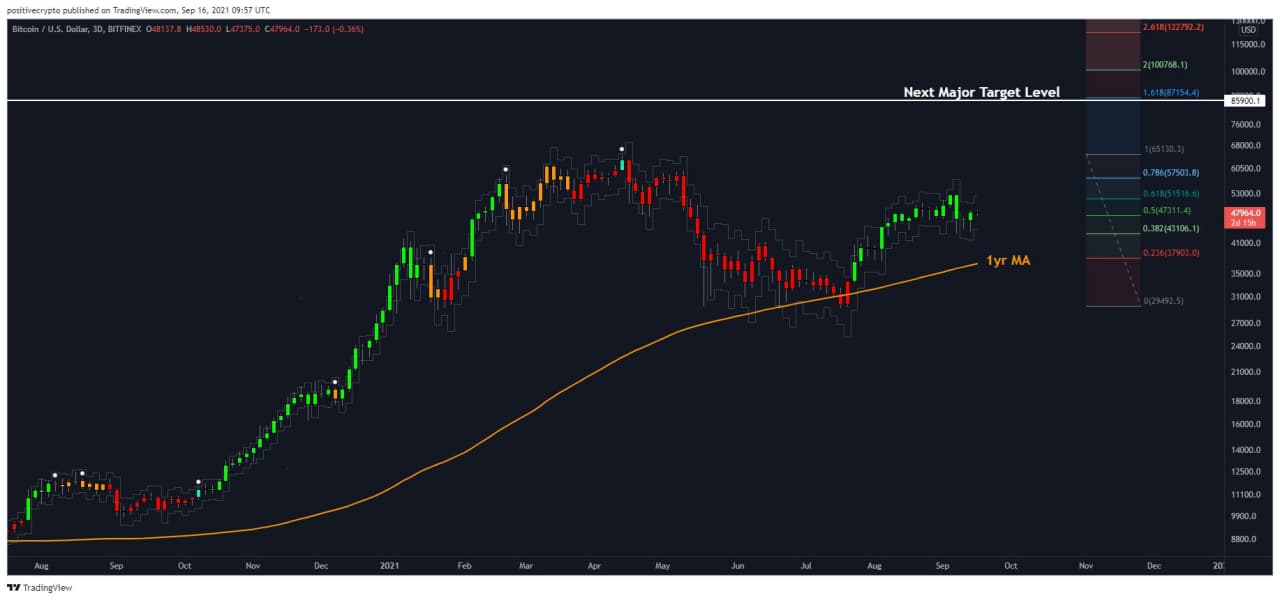
Figure 7: Predator 3-day continues to show bullish trend continuation
YOU CAN ACCESS PREDATOR HERE.
If price does rally in the way we expect it might in the coming weeks, then our first major target is a level that front-runs the 1.618 fib retracement level at $85,900. We do not think this will be the major cycle high but may present a point of resistance ahead of a potential parabolic run that takes us beyond $100,000.
From a cycle high perspective, the Bitcoin Investor Tool upper band level is currently sitting at $112,000 but will trend higher as price attempts to catch up with it.
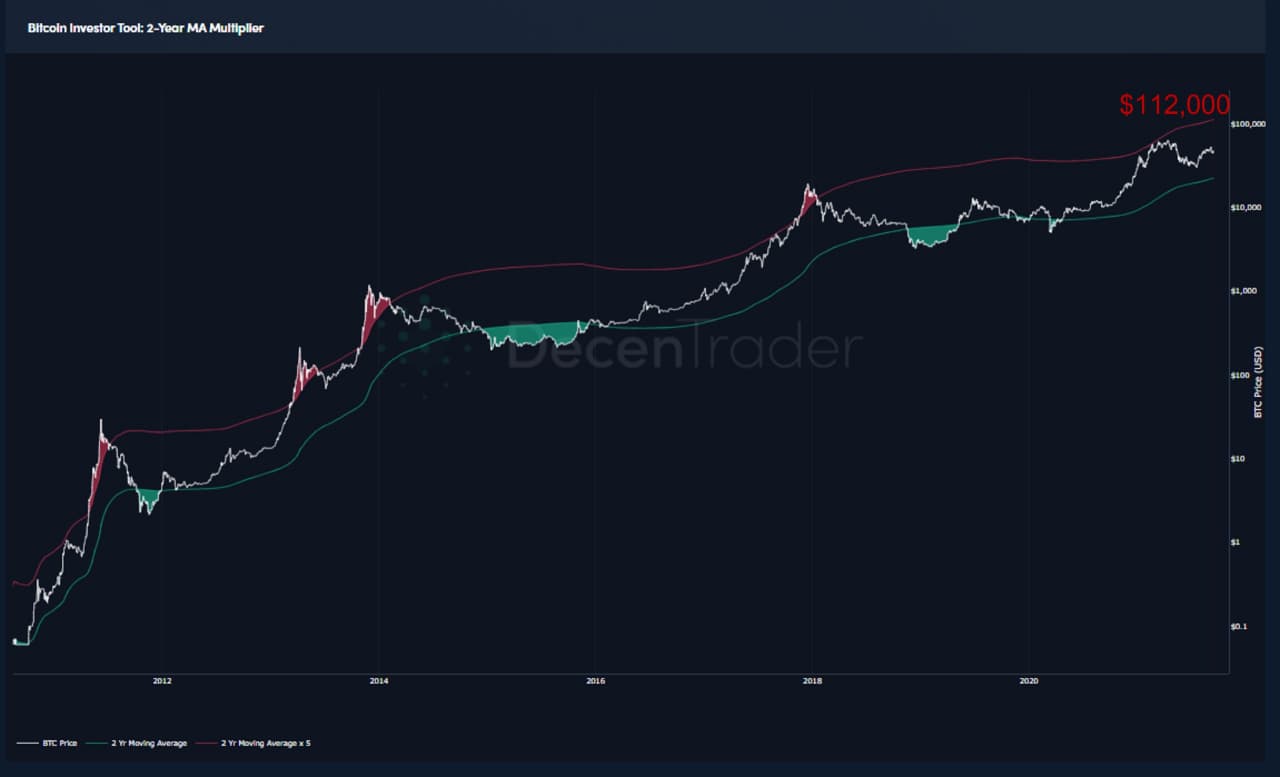
Figure 8: Bitcoin Investor tool captures the major highs and lows of Bitcoin market cycles
Historically, price has rallied beyond the red line (2yr MA x 5) in the blow-off-top stages of adoption phase market cycles. Should that happen again, then we should see price push through the upper red line and trend higher.
Concluding thoughts
So with bullish signals in the near term we could now be setting up for a major run that first takes $BTC up towards $85,000 before breaking through the psychological barrier of $100,000. Making for an explosive Q4 2021.
Good luck in the markets and happy trading!
Like what you read? For the regular market analysis and live streams with PositiveCrypto and FilbFilb, join us HERE. from as little as $1 per day.
Disclaimer: Nothing within this article should be misconstrued as financial advice. The financial techniques described herein are for educational purposes only. Any financial positions you take on the market are at your own risk and own reward. If you need financial advice or further advice in general, it is recommended that you identify a relevantly qualified individual in your Jurisdiction who can advise you accordingly.


